---
title: "EMS site: Power Flow"
url: "https://ensights.productfruits.help/en/article/ems-site-power-flow"
language: "en"
last_updated: "2026-10-06T10:10:52.259Z"
---
# EMS site: Power Flow
## What the Power Flow panel is for
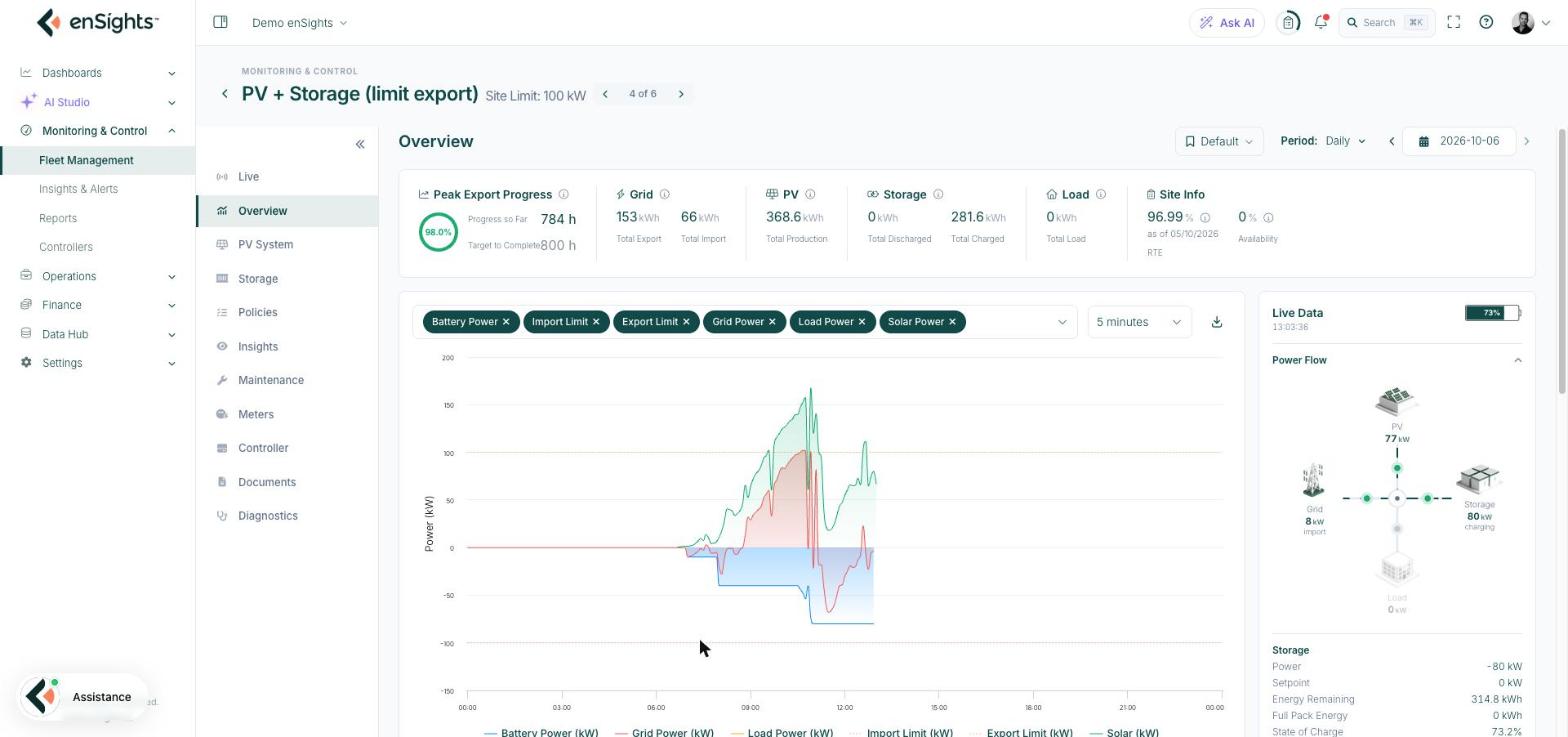
The Power Flow panel answers one question at a glance: **where is this site's power moving right now?** It sits in the **Live Data** panel on the right side of an EMS site's **Overview** tab (**Fleet Management → EMS Sites → click a site → Overview**), and it is the fastest way to confirm that solar production, the battery, the grid connection and the local load are behaving the way the site's active policy says they should.
## Reading the diagram
The diagram places the four sides of the site around a central junction, with live figures under each one:
| **PV**
(top) | Instantaneous solar production, in kW — the combined output of the site's inverters. |
| --- | --- |
| **Grid**
(left) | Power at the grid connection point, labelled
**import**
(the site is drawing from the grid) or
**export**
(the site is pushing to the grid). |
| **Storage**
(right) | Battery power, labelled
**charging**
or
**discharging**
. |
| **Load**
(bottom) | Local consumption behind the meter, in kW. |
The moving dots on each leg show which way power is flowing at this moment, so you can trace the path — for example solar feeding the battery and the surplus going out to the grid. A greyed-out icon with **0 kW** simply means there is no measured flow on that leg right now; it is not an error.
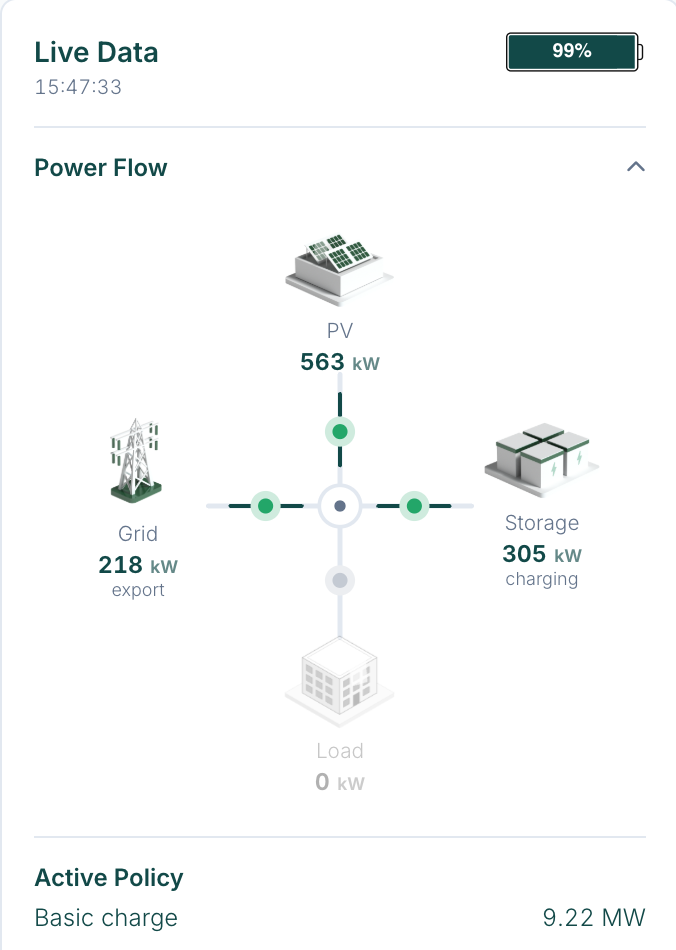
Above the diagram, the **Live Data** header carries two things worth checking before you read any number: the battery badge, which is the storage system's current state of charge, and the timestamp, which is when the last live sample arrived. If the timestamp is not advancing, you are looking at stale data, not a frozen site.
## Active Policy and the detail readings
Directly under the diagram, **Active Policy** names the policy the EMS controller is executing right now — with its setpoint, the months it runs and today’s active window — for example **Basic charge** with a 9.22 MW target. This is the intent; the diagram above it is the reality. Policies themselves are configured on the site's **Policies** tab.
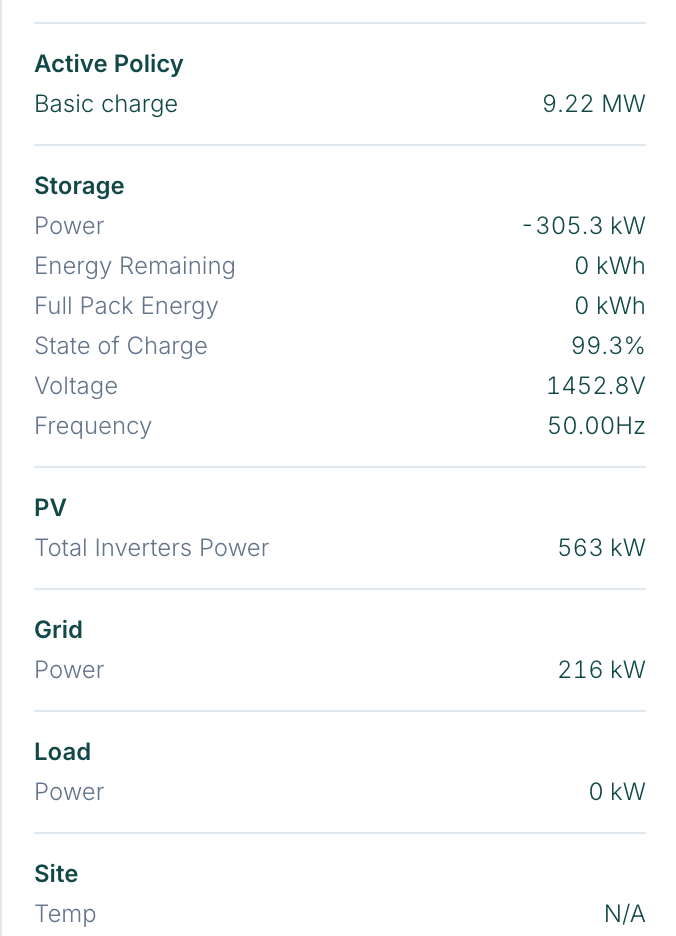
Below that, the panel lists the exact readings behind the picture:
| **Storage** | **Power**
(signed — see Notes),
**Energy Remaining**
,
**Full Pack Energy**
,
**State of Charge**
,
**Voltage**
and
**Frequency**
. |
| --- | --- |
| **PV** | **Total Inverters Power**
— the same figure as the PV node in the diagram. |
| **Grid** | **Power**
at the connection point. |
| **Load** | **Power**
consumed on site. |
| **Site** | **Temp**
— shows
**N/A**
when the site has no weather sensor reporting. |
## How to
1. **Check that a site is doing what its policy says.** Read **Active Policy**, then look up at the diagram: a charge policy should show the Storage leg **charging**, a peak-export commitment should show a steady Grid **export**. A mismatch between intent and flow is the first thing to investigate.
2. **Confirm the battery is charging from solar rather than the grid.** While the sun is up you want the dots running PV → Storage with Grid showing **export** or a small import. Storage **charging** together with a large Grid **import** at midday deserves a look at the policy setup.
3. **Spot a stale feed.** Glance at the timestamp under **Live Data**. If it stopped advancing, check the site's connectivity on the **Diagnostics** tab before drawing any conclusion from the numbers.
4. **Sanity-check the balance.** Power in must go somewhere: production plus grid import should roughly equal load plus storage charging plus grid export. Small gaps are conversion losses and metering differences; a large gap usually means one device is not reporting.
## Notes
- **The Storage sign convention.** In the detail list, Storage **Power** is signed: a negative value means the battery is charging, a positive value means it is discharging. The diagram spares you the sign by writing **charging** or **discharging** next to an unsigned number — so **\-305 kW** in the list and **305 kW charging** in the diagram are the same reading.
- **These are instantaneous kilowatts, not energy.** The panel tells you what is happening this second. For how the day unfolded, use the chart on the left of the Overview tab or the KPI cards above it, which sum kWh over the selected period.
- **A zero is not always a measurement.** **Energy Remaining 0 kWh** next to a 99% **State of Charge** means the battery does not report that field — not that the pack is empty. When a reading looks implausible, the **Diagnostics** tab shows what the site is actually sending.
- The **Power Flow** section is collapsible — the chevron next to its title folds the diagram away and leaves the detail readings visible.