---
title: "Live Health: what each PV system status means"
url: "https://ensights.productfruits.help/en/article/live-status-what-each-pv-system-status-means"
language: "en"
last_updated: "2026-10-01T09:02:40.435Z"
---
# Live Health: what each PV system status means
Live Health tells you what state each PV system is in right now: working, asleep for the night, faulty, not communicating, or online but producing nothing. Asset managers and monitoring teams use it to separate a system that has gone offline from one that is connected but has generated zero, because the two need very different actions.
## Where you see it
- **PV Systems table** — the **Live Health** column shows a coloured badge for every system.
- **System detail view** — the same badge appears next to the system name when you open a system.
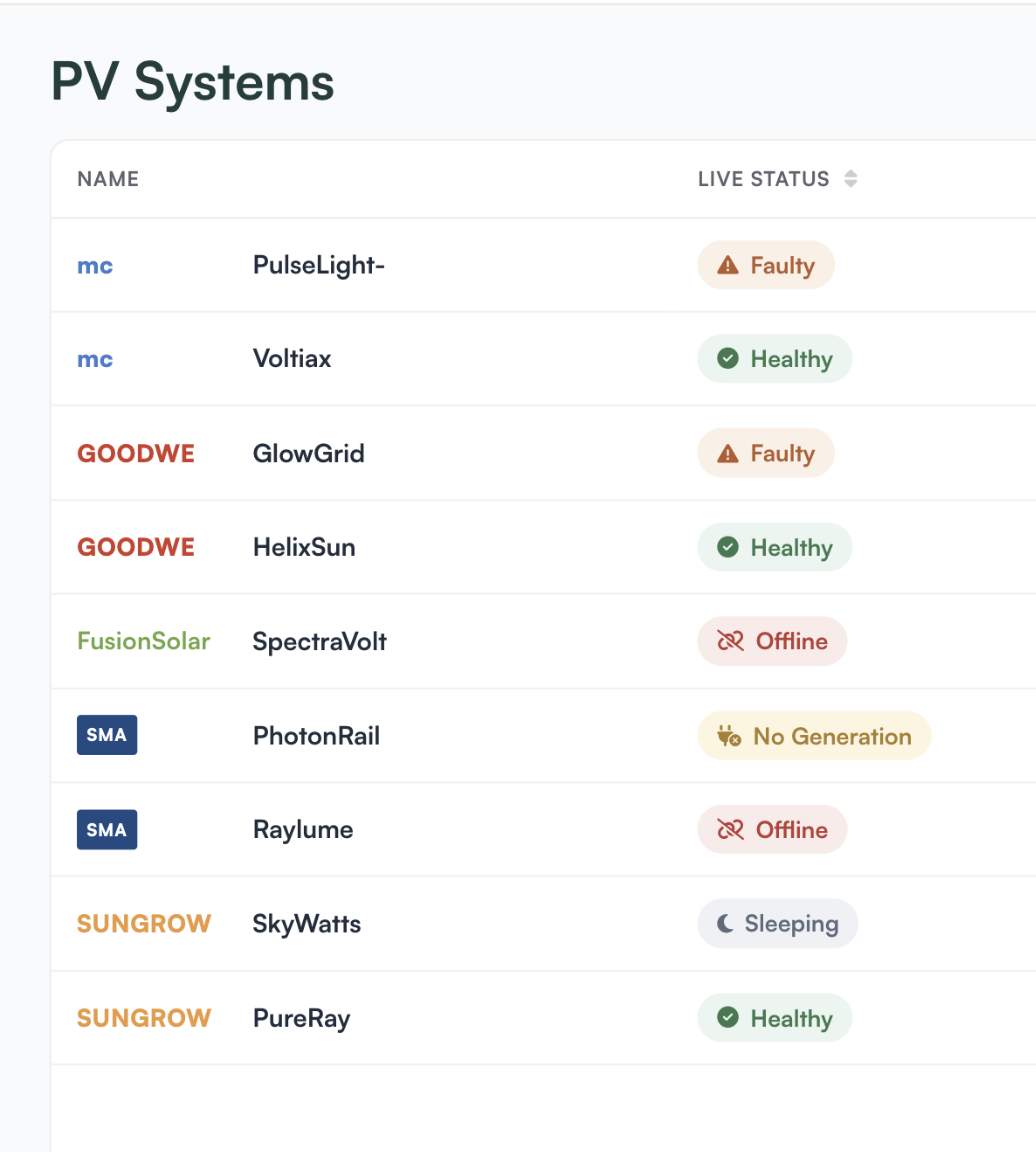
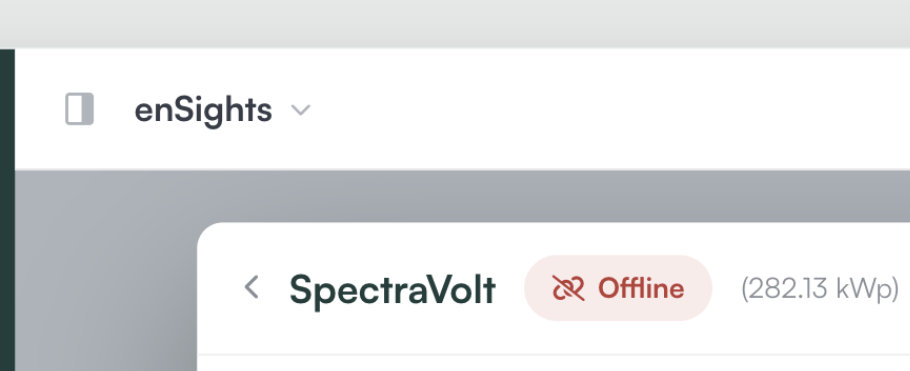
The badge looks the same and uses the same wording in both places.
## What each status means
Live Health is worked out from the alerts that are currently open on the system.
| Status | What it means |
| --- | --- |
| **Healthy** | No open alerts on the system. |
| **Sleeping** | The system is in a period when it isn't expected to generate, such as at night. This is normal and is not treated as a problem. |
| **Faulty** | An alert is open that is not a no-generation, no-communication or API error alert — for example an inverter or performance alert. The system is reporting, but something needs a look. |
| **Offline** | A
**No Communication**
or
**API error**
alert is open. enSights is not receiving data from the system, so its production for the day is unknown rather than zero. |
| **No Generation** | A
**No Energy Generation**
alert is open. The system is communicating but producing no energy when it should be. |
### When more than one applies
Every system shows exactly one status. If several conditions are true at once, the most severe wins, in this order:
1. **No Generation**
2. **Offline**
3. **Faulty**
4. **Sleeping**
5. **Healthy**
So a system with an open inverter alert shows **Faulty** even at night, and a system with both a no-communication alert and a no-generation alert shows **No Generation**.
### Live, not for the period
Live Health reflects the system's state now. It does not change when you move the period selector to last week or last month — the production columns do, the status does not. The status changes when alerts open or close: once the alert behind a **Faulty**, **Offline** or **No Generation** status is resolved, the system moves back to **Healthy** (or **Sleeping**, outside generating hours).
## Sorting and filtering
| Action | What it does |
| --- | --- |
| Sort by
**Live Health** | Ascending puts the healthiest systems first: Healthy, Sleeping, Faulty, Offline, No Generation. Descending puts the most severe first. |
| Filter →
**Live Health** | Select one or more statuses to show only those systems. |
| **Preferences**
(sliders icon) | Show or hide the
**Live Health**
column. |
## How to
### Tell offline systems apart from zero-production systems
1. Open the PV Systems table and filter **Live Health** to **Offline** and **No Generation**.
2. Treat **Offline** systems as a data or connectivity problem: check the logger, the network or the vendor connection. Their production is missing, not zero.
3. Treat **No Generation** systems as a site problem: the data is arriving and shows no output, so a site visit or inverter check is usually the next step.
### Put the worst systems at the top every morning
1. Sort the table by **Live Health**, descending, so **No Generation** and **Offline** come first.
2. Save it as a view (for example "Morning triage") and mark it as your favourite so the page opens on it.
### Check a single system while you're in its detail view
1. Open the system. The badge next to its name shows the current status.
2. If it isn't **Healthy** or **Sleeping**, go to the system's insights to see which open alert is causing it.
## Notes
- Live Health is additive. The **Production** column and every other column work exactly as before; a production value on its own still can't tell you whether a system was offline or produced nothing. Use Live Health for that.
- The status is only as current as the alerts. If an alert rule is switched off for a system, the condition it covers won't show in Live Health. Alert rules are managed in *System Settings: Alerts Management*.
- **Sleeping** uses the same expected-generation hours as the alerts, so a system isn't flagged during hours it isn't expected to produce.
- The **Fleet Health** bar in the KPI summary shows the same five statuses across the systems in the current list.