
Data Hub: MCP
What this page is for
MCP — the Model Context Protocol — is an open standard for letting AI tools query a system directly. This page gives you the endpoint that connects your enSights account to any MCP-compatible tool your team already uses.
The practical effect is that you stop copying data out of the portal to ask questions about it. Instead of exporting a spreadsheet to work out which sites underperformed last month, you ask the question where you are already working and the tool fetches the answer from enSights itself.
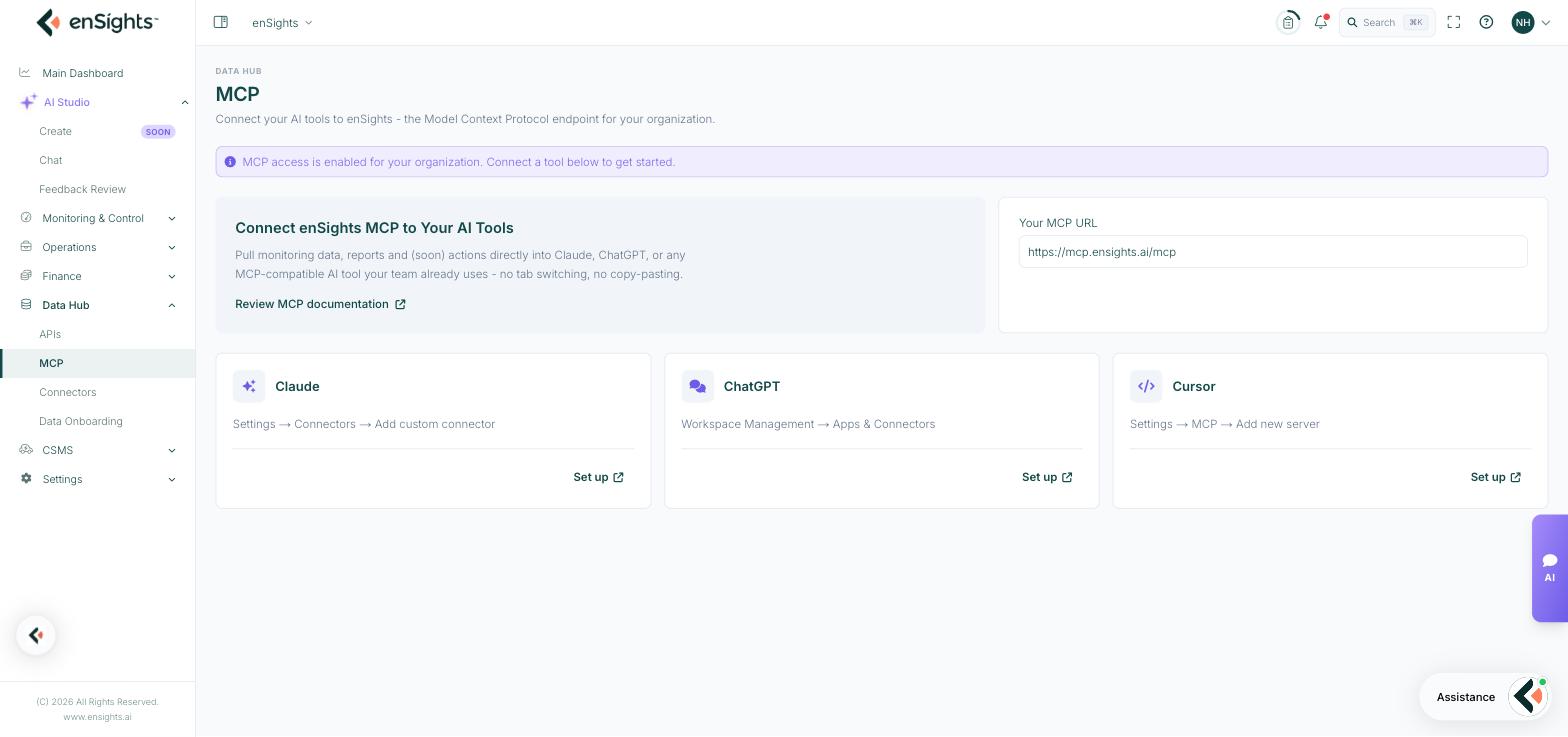
Is it switched on?
A banner at the top tells you whether MCP access is enabled for your organisation. If it is not, the feature is turned on per tenant — in Settings → Tenants → Features, under AI Access (MCP) — so speak to whoever administers your account.
Your MCP URL
A single field on the right holds the endpoint address for your organisation. This is what you paste into the AI tool. Treat it as an access route to your fleet data rather than a public address: anyone who adds it to their own tool is asking your account for data.
The address is https://mcp.ensights.ai/mcp — the same one shown in the field and the one you add to Claude, ChatGPT, Cursor or any other MCP-compatible tool. Access is controlled by your enSights login, not by the address.
What it can do
Today MCP is read-oriented: it pulls monitoring data and reports into the AI tool. Actions — having the tool change something in enSights rather than just read it — are described on the page as coming later. In Settings → Tenants → Features you can see this reflected in the separate feature flags: MCP Read — Core Tables is live, while MCP Write and MCP Actions are reserved.
So: good for questions, not yet for instructions.
Using MCP with your AI assistant
enSights MCP is an open, model-agnostic connector. Once it's linked, your AI assistant can read your live enSights data and turn it into finished work: dashboards, decks, spreadsheets, digests, and answers — in plain language, no code.
It works with any MCP-compatible assistant (Claude, ChatGPT, Cursor, Copilot, or your own agent). Access is read-only and permission-scoped: you see exactly the assets your enSights account already sees, nothing more.
Contents
- Before you start
- Get connected
- Your first ask
- How to brief your assistant
- Data you can reach
- What you can create
- Playbooks by role
- Prompt cheat sheet
- Tips for better results
- Limits & good to know
- Troubleshooting
- Security & privacy
1 · Before you start
You need three things:
Requirement | Detail |
An enSights account | Your normal portal login. The connector shows only the sites, systems and cases your account can already see. |
MCP enabled for your organization | AI access is enabled per organization. If it isn't on yet, the consent screen will say "Not enabled for your organization" — your account admin can contact enSights to switch it on. |
An MCP-compatible assistant | Claude (web, desktop, or Claude Code), ChatGPT, Cursor, Copilot, or any custom agent that speaks MCP. |
The connection details:
Field | Value |
Server URL (endpoint) | |
Transport | Streamable HTTP |
Authentication | OAuth 2.0 (authorization code + PKCE) — you sign in with your normal enSights credentials |
Scope |
|
There is no API key to copy, no token to paste, and nothing to install on your machine.
2 · Get connected
The flow, in short
- Add
https://mcp.ensights.ai/mcpas a connector in your assistant. - Your browser opens the enSights consent page.
- Sign in with your enSights account (if you aren't already).
- Review what the assistant is asking for — sites, fleets and assets; generation and performance; insights and alerts — and click Allow.
- You're returned to your assistant. The enSights tools are now available.
You only do this once per assistant. If your session later expires, your assistant will prompt you to reconnect and you repeat steps 3–4.
Claude (web or desktop)
- Open Settings → Connectors.
- Choose Add custom connector.
- Name it
enSightsand paste the URL:https://mcp.ensights.ai/mcp - Save, then click Connect and complete the enSights sign-in and consent.
- Start a new chat — enSights appears in the tools list.
Claude Code (terminal)
claude mcp add --transport http ensights https://mcp.ensights.ai/mcp
Then run /mcp inside Claude Code and authenticate when prompted.
ChatGPT
- Open Settings → Connectors (or Apps & Connectors).
- Add a connector / MCP server.
- Paste
https://mcp.ensights.ai/mcpas the server URL, name itenSights, and choose OAuth for authentication. - Connect and complete the enSights sign-in and consent.
Cursor, Copilot, or a custom agent
Add an HTTP MCP server pointing at the same endpoint. Most clients accept a config block like this:
{
  "mcpServers": {
    "ensights": {
      "type": "http",
      "url": "https://mcp.ensights.ai/mcp"
    }
  }
}
The client handles the OAuth handshake for you — registration is open, so nothing needs to be pre-provisioned. If your client only supports stdio transports, use a bridge such as mcp-remote pointed at the same URL.
Check it worked: ask your assistant "List my enSights sites." If you get a table of your sites back, you're connected.
3 · Your first ask
Five minutes, three asks — from a question to something you can send to a customer:
- "How did my whole fleet do last month versus expected?" → a portfolio summary: energy, expected energy, availability, revenue.
- "Which five sites fell furthest below model? Chart them." → a ranked shortfall chart.
- "Turn that into a one-page summary I can send to the asset owner." → a finished document, with the live numbers already in it.
Nothing was exported, re-keyed, or copied out of a dashboard.
4 · How to brief your assistant
You're not typing commands — you're briefing an agent to build something. The clearest briefs name three things:
Name this | Examples |
What to create | an answer, a table, a chart, a dashboard, a deck, a spreadsheet, a scheduled digest |
Which and when | one site, a group, or the whole fleet — and a date range |
How | ranked, filtered, in dollars, by month, only high-severity, refreshed daily |
A good brief:
"Show me the 10 sites that fell furthest below their expected yield in June, as a ranked table, and flag any that also have open faults."
The assistant works out which data to pull and chains the steps for you. If a brief is ambiguous, a good assistant will either ask or pick a sensible default and tell you what it assumed.
5 · Data you can reach
Seven capability areas, powered by eight live tools.
Area | What's in it |
Fleet & asset inventory | Every site, PV system and battery you can see — names, capacity, location, vendor/model, configuration, tags |
Solar generation & performance | Actual vs. expected energy, revenue, ROI, availability, capacity — by day or month, per system and portfolio-wide |
Storage / battery analytics | State of charge, battery/grid/load power, energy import/export, round-trip efficiency |
Metering & consumption | Per-meter site time-series — import/export energy, per-phase voltages and currents |
Insights & alerts | The alert feed across solar, storage and EV — code, severity, status, device, first/last seen, occurrences, downtime |
Maintenance & service | Service cases — id, title, type, status, priority, linked asset, due date, attachments, comment count |
Financial & losses (derived) | Revenue, ROI, realized tariff, and the monetary value of downtime and underperformance |
Fleet & asset inventory
The registry that ties everything else together — sites, PV systems, batteries, and the meters and charge points on each.
- "List every site with its PV capacity and battery, grouped by country."
- "Which batteries are Tesla vs. Sungrow, and what's their total kWh?"
You get: a structured table or spreadsheet of your portfolio.
Solar generation & performance
Actual vs. expected energy (kWh), revenue, ROI, availability and capacity — the yield and underperformance engine.
- "How much did the fleet generate last month vs. expected?"
- "Rank all sites by shortfall to model in June and chart the top 10."
You get: performance summaries, over/under-model rankings, availability tracking, trend charts — the basis of QBRs and investor reporting.
Storage / battery analytics
Battery time-series plus nameplate data (capacity, power limit, vendor, model).
- "Plot this battery's state of charge over the last week."
- "What was the round-trip efficiency of my largest BESS last month?"
You get: SoC and power profiles, round-trip efficiency, self-consumption analysis, charts.
Metering & consumption
Per-meter site readings from the meters configured on each site (e.g. main_meter).
- "Show grid import vs. export for this site yesterday."
- "Compare metered energy to inverter generation for this site last week."
You get: consumption and production profiles, meter-vs-inverter reconciliation, load analysis.
Insights & alerts
The diagnostic feed across all asset types, filterable by domain (solar / storage / EV), status (open / closed) and date range.
- "Which sites have open high-severity faults, how long have they been open, and what's the total downtime? Build me a dashboard."
- "Top fault codes across the fleet this quarter."
You get: triage queues, live alert dashboards, downtime and fault-code breakdowns, per-site health.
Maintenance & service
Work orders and service cases, filterable by status, asset type and due-date range. Role-aware — technicians see only their own cases.
- "What's open on the maintenance schedule this month, grouped by type and priority?"
- "List overdue malfunction cases and which sites they're on."
You get: work plans, overdue-case lists, service-load summaries, preventive-visit tracking.
Financial & losses
Revenue, ROI and realized tariff come straight from generation data; the monetary value of losses is derived by combining generation, availability and the loss attributed to each insight.
- "Quantify energy losses at this site by cause and price them in dollars."
- "Build a losses waterfall for the worst-performing site this quarter."
You get: loss waterfalls, revenue and ROI summaries, value-at-risk framing for QBRs and investors.
6 · What you can create
Every capability above can become a finished, shareable artifact — or a standing automation.
Create | Describe it like this | Format |
QBR / performance deck | "Build a QBR deck for [site] for H1 2026" | PowerPoint |
Loss waterfall | "Show a losses waterfall for [site], in kWh and $" | Chart / diagram |
Alert triage dashboard | "Live dashboard of open high-severity faults by site" | Interactive page |
Fleet inventory sheet | "Export every PV system with capacity, location and June generation" | Excel |
Availability & performance report | "Monthly availability and performance per site, last 6 months" | Table / chart |
Investor portfolio summary | "One-page portfolio summary: generation, revenue, uptime by site" | Doc / PDF |
Morning fleet digest | "Every weekday at 7am, summarize new faults and underperformers" | Scheduled task |
Custom mini-tool | "Build a page where I pick a site and see its live status" | Interactive app |
Reusable workflow | "Save this as a skill called 'fleet-health' I can re-run anytime" | Saved skill |
Turn a workflow into something reusable
Once you've built something useful, save the whole workflow — pull the data, analyze, build the output — under a name you and your team invoke on demand. Each run re-pulls live data, so it's never stale. Recurring work becomes one word instead of a fresh brief every time. (Available in assistants that support saved skills, such as Claude.)
"Save this as a skill called 'fleet-health': pull open high-severity faults, rank underperformers vs. model, and summarize the top 5."
7 · Playbooks by role
O&M / field operations — keep the fleet running, triage and close faults
"Which sites have open high-severity faults, ranked by downtime? Show a dashboard."
"Build me a morning digest of new alerts and overdue service cases."
"Is this alert actually costing generation, or is it telemetry-only?"
Asset manager / investor — protect yield and returns
"Portfolio generation vs. expected last quarter, with ROI per site."
"Which sites are missing their performance guarantee, and by how much?"
"Quantify and price avoidable losses across the fleet this year."
Energy analyst — dig into the time-series
"Compare metered vs. inverter energy for this site and explain the gap."
"Battery SoC and round-trip efficiency for my top 5 BESS last month."
"Correlate the June generation dip at this site with its alert history."
Maintenance planner — plan the month's service load
"Open service cases this month by type and priority."
"Which sites have both an overdue case and an open fault?"
Account / customer-facing — show value, catch risk early
"Generate a customer-ready QBR for this account's sites."
"Flag any site with long-open alerts or missing data this week."
8 · Prompt cheat sheet
Goal | Copy-paste prompt |
Portfolio pulse | "How did the whole fleet do last month vs. expected?" |
Find underperformers | "Rank sites by shortfall to model in June; chart the top 10." |
Triage faults | "Live dashboard: open high-severity faults by site, with days open and downtime." |
Price losses | "Losses waterfall for [site] this quarter, in kWh and $." |
Battery check | "SoC and round-trip efficiency for [battery] last week." |
Meter reconciliation | "Compare main meter energy to inverter generation for [site] yesterday." |
Maintenance plan | "Open service cases this month by type and priority." |
Build a deck | "QBR deck for [site], [period], covering yield, uptime and losses." |
Export data | "Spreadsheet of all sites: capacity, location, last-month generation." |
Automate it | "Run that every weekday at 7am and send me the summary." |
Save it | "Turn this workflow into a reusable skill called 'fleet-health'." |
9 · Tips for better results
- Name the artifact. "Deck", "spreadsheet", "dashboard", "chart", or "just the number" — say which.
- Name the site and the dates. "[Site], June 2026" beats "that big site lately."
- Rank or filter. "Top 10 by…", "only high-severity", "only sites below model."
- Price it. Add "in dollars" to turn energy into money.
- Narrow the range first. Ask for a month, look at it, then widen — much faster than pulling a year up front.
- Ask it to show its working. "Which sites did you include?" catches mismatched scope early.
- Iterate, then automate. Anything built once can be refined, saved, or scheduled to rebuild itself.
10 · Limits & good to know
- Read-only. The connector reads data. It cannot close a case, acknowledge an alert, or change anything in enSights.
- Permission-scoped. You see only the assets your account can see. Technicians see only their own service cases.
- Model-agnostic. Any MCP-compatible assistant works. The prompts in this guide are the same everywhere.
- Results come in pages. Inventory calls return up to 200 rows at a time; alerts and maintenance return 50 by default (up to 200). Your assistant pages through automatically — and the totals in the data always cover everything, so trust the total over the row count.
- Time-series are down-sampled. A single call returns up to 288 points, and up to 10 batteries at a time. Ask for one battery to get a full-resolution day; ask for several and you'll get a coarser comparison.
- Big pulls take a moment. Fleet-wide history is a lot of data. Narrowing the date range is the fastest fix.
- Mind the data. Some sites have gaps, offline periods, or mixed-currency revenue. A good assistant flags these rather than hiding them — ask it to.
- The assistant can still be wrong. It's reading real data, but the analysis is generated. Spot-check anything going to a customer or a board.
11 · Troubleshooting
What you see | What it means | What to do |
"Not enabled for your organization" | AI access isn't switched on for your account yet | Admins: use the Contact enSights button on that screen. Everyone else: ask your account admin to get in touch with enSights. |
"This link has expired" | The consent request timed out | Go back to your assistant and start the connection again. |
Asked to sign in mid-flow | You had no active portal session | Sign in with your normal enSights credentials; you'll be returned to the consent screen. |
Assistant says it has no enSights tools | The connector isn't enabled in that chat, or the session dropped | Check the connector is toggled on for the conversation, then reconnect from your assistant's settings. |
Empty or partial results | Filters too narrow, no data in the range, or the asset is outside your permissions | Widen the date range, check the site name, and ask the assistant which assets it could and couldn't reach. |
A request times out | The pull is too large | Narrow to one site or one month and build up from there. |
12 · Security & privacy
- Authentication uses OAuth 2.0 with PKCE against your existing enSights account. No API keys are issued and no password is ever shared with the assistant.
- The connector is granted the
ensights:readscope only — read access, nothing else. - Consent is explicit: you see which application is asking, and what it will be able to read, before you approve.
- Access is bounded by your own permissions. Connecting an assistant never widens what you can see.
- You can revoke access at any time from your assistant's connector settings; disconnecting stops all further data access immediately.
Notes
- Verify before you rely. AI tools can misread a result as easily as they can read it. Check the first few answers against the portal.
- The connection carries your account's data into a third-party tool. Make sure that is compatible with your own data policies before rolling it out to a team.
- Ask questions the platform can answer. MCP surfaces what enSights holds — production, alerts, assets, maintenance. It does not know your commercial context unless that is in the platform too.
- Actions are not yet available. An AI tool cannot close an alert or open a service call over MCP today.