
EMS site: Meters, Controller and Diagnostics
Fleet Management → EMS Sites → a site → Meters / Controller / Diagnostics
Meters
Everything the site's meters report. On the left is the meter list with Select All Meters, so a site with several meters can be read together or one at a time.
The chart works like the others — metric chips (Power and the rest of the channels), a granularity selector, a settings gear and a CSV download.
The quality panel
To the right, two tables summarise the electrical channels for the period:
- Voltage (kV) — one row per channel (V12, V23, V31, V1, V2, V3) with Last Read, Min, Max, Avg and Variance.
- Current (A) — the same for I1, I2, I3.
These are the fastest way to catch a wiring or phase problem: an unbalanced set of currents, or a phase voltage that never moves, shows up here long before it shows up in energy totals.
The interval table
Below the chart, the raw readings: Date, Power, Voltage, I1, I2, I3, Periodic Energy Import and Periodic Energy Export. This is the table to export when an off-taker or grid operator queries a reading.
Controller
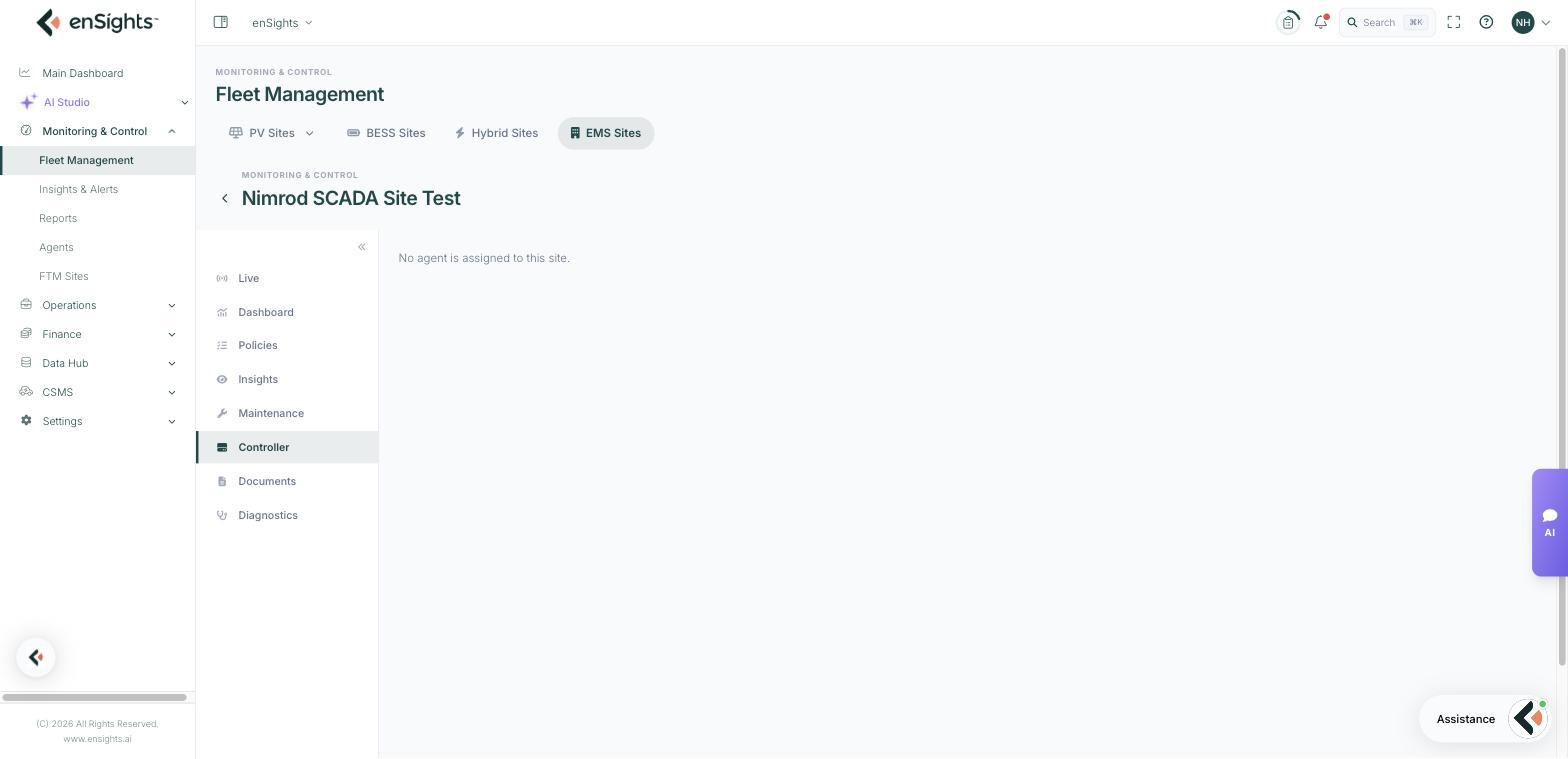
The controller tab shows the agent assigned to the site — the on-site device that carries commands to the equipment and readings back. When none is assigned it says plainly: No agent is assigned to this site.
That message explains a whole class of symptoms: a site stuck at Pending on the EMS list, policies that save but never take effect, a Live tab that will not render. Without an agent there is no path to the equipment. Agents themselves are managed under Monitoring & Control → Agents, where you can see their status, resources and network, fetch logs and restart them.
Diagnostics
Diagnostics collects logs from the site's IoT device and has AI analyse them. The flow is shown on the page in three steps:
- Command sent to device
- Logs collected
- AI analyzes & reports
Run Diagnostics starts it. Auto-refresh keeps the page updating while it works, and Report History on the left keeps every previous run, so you can compare a device's health before and after an intervention.
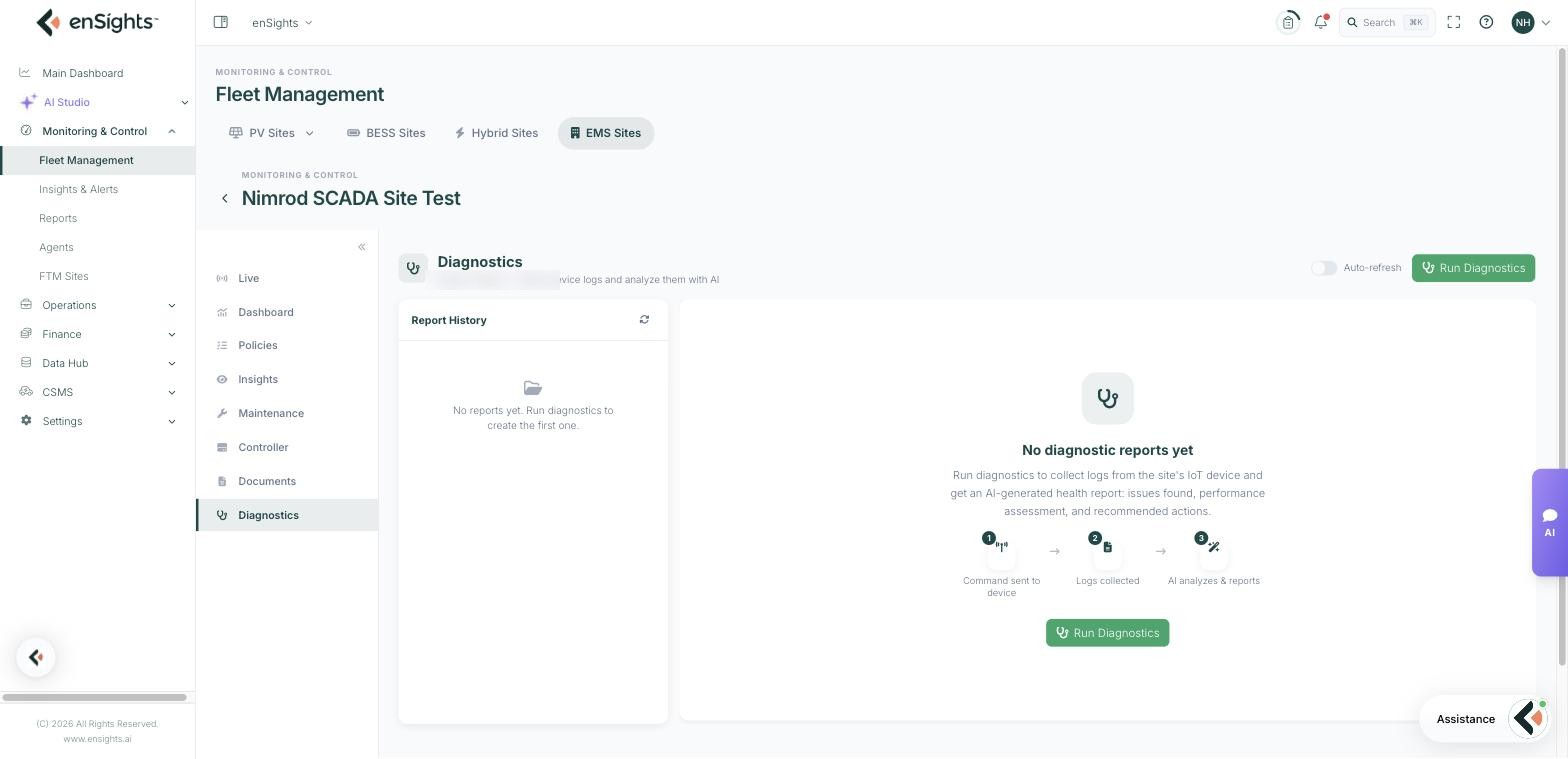
The report names the issues found, assesses performance and recommends actions. Use it before escalating to your integrator — it usually turns "the site is not responding" into a specific fault, and the report is something you can attach to the ticket.
Common tasks
Diagnose a site that will not respond. Controller first (is there an agent?), then Diagnostics → Run Diagnostics, then the Agents page for the device's own status.
Check a meter before a billing dispute. Meters → set the period → read the Voltage and Current tables for anomalies → export the interval table.
Catch a phase problem. Compare I1, I2 and I3 in the Current table. A persistent imbalance is worth a site visit.
Build a history for a flaky device. Run diagnostics whenever it misbehaves; Report History becomes the evidence trail.
Common questions
Diagnostics returns nothing.
The device must be reachable to send logs. If the agent is offline, diagnostics cannot run — start with the Agents page.
Do I need an agent for every EMS site?
Yes, for control. Monitoring can work through a vendor integration, but commands need an on-site agent.
The meter chart is empty but the interval table has rows.
No metric is selected in the chip field, or the chosen channel is not reported by the selected meter.