
PV site: Invoices and P&L Tracker
Fleet Management → PV Sites → a system → Invoices / P&L Tracker
Invoices
This tab reconciles what was billed against what the site actually produced. It opens on a Yearly period and filters by invoice state with the chips across the top: All, Draft, In Process, Rejected, Approved, Pending, Paid, Canceled, Need Attention and Alerts.
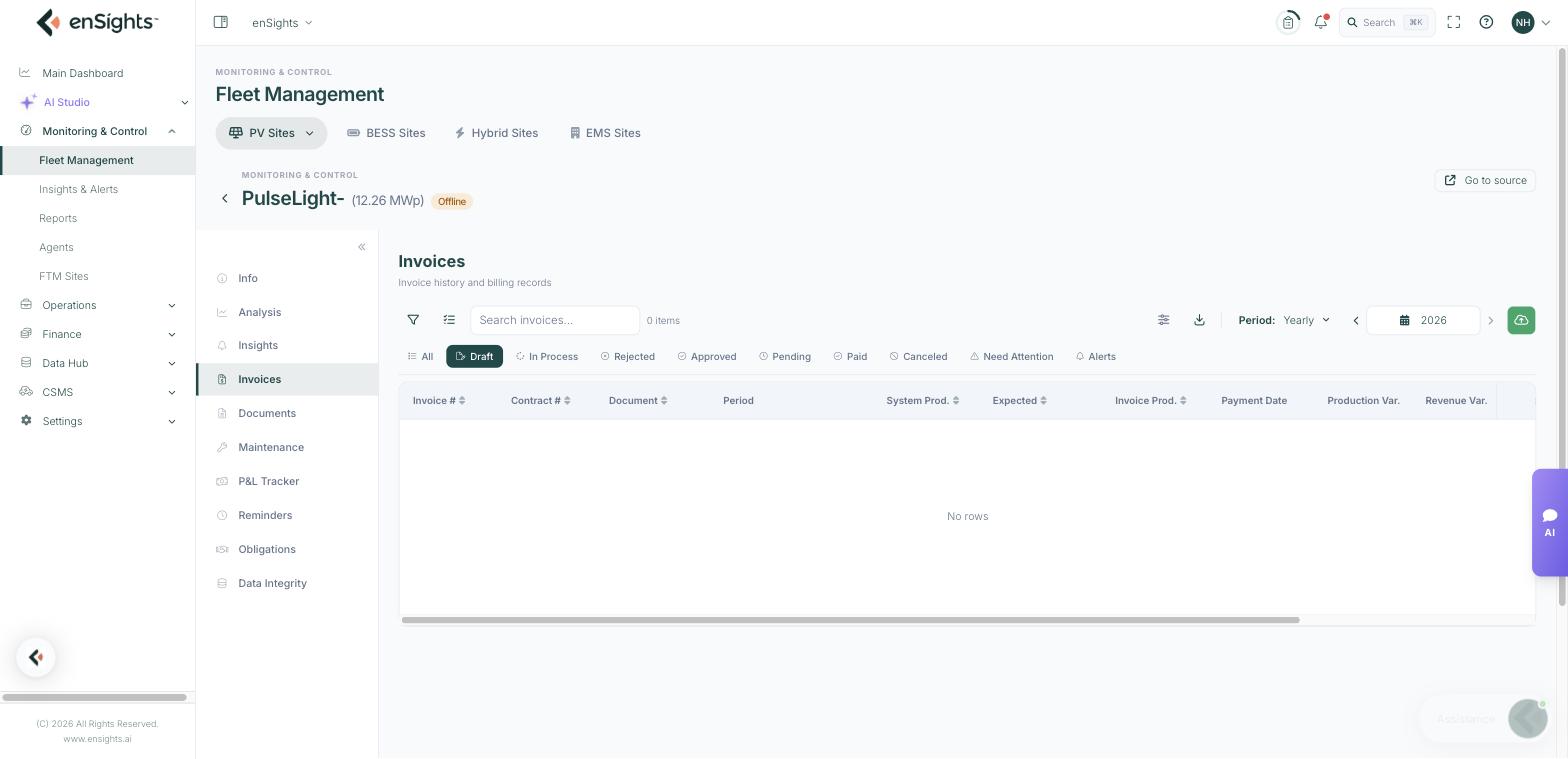
The columns that matter
- Invoice # and Contract # — the billing document and the contract it belongs to.
- Document — the generated invoice file.
- Period — the billing period covered.
- System Prod. — production as measured by the portal, and Expected beside it.
- Invoice Prod. — the production the invoice was raised on.
- Production Var. — the difference between the two. This is the number that catches billing errors, and it should normally be zero or close to it.
- Revenue Var. — the same comparison in money.
- Meter Prod. and Meter Var. — the revenue-grade meter reading and its variance, which is the version an off-taker will usually accept.
- Payment Date and Status — where the invoice is in its lifecycle.
Need Attention is the chip to check first each month: it collects the invoices whose variance or state needs a human decision.
P&L Tracker
A month-by-month grid of the site's financial performance for the year, built from the categories configured in System Settings → Financials.
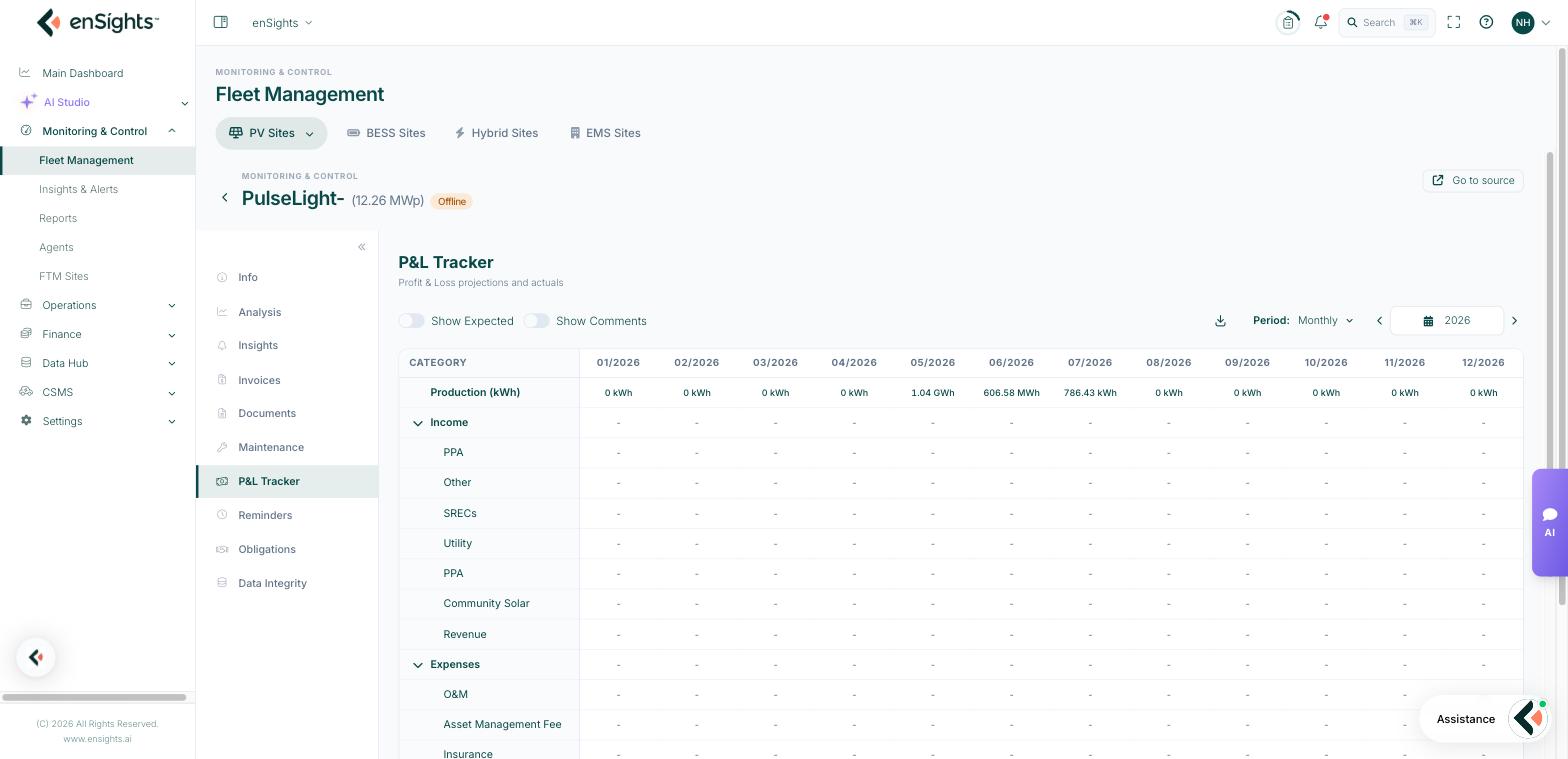
The rows run from production down to cash:
- Production (kWh) — the physical basis for everything below.
- Income, with its components — PPA, SRECs and any other income category you have defined.
- Expenses, with Asset Management Fee, Insurance, Additional Costs, Lease Rates, O&M, Property Taxes and Equipment Reserves.
- Net Operating Income — income less operating expenses.
- Project Costs, ITC and Debt — the capital and financing lines.
- Cash Flow — the bottom line for the month.
Two toggles change what you see: Show Expected adds the budgeted figure beside each actual, so variance is readable at a glance, and Show Comments reveals the notes left against individual cells — which is where the explanation for an odd month usually lives.
Dashes mean no value is configured for that category and month, not zero. If a whole row is dashes, that category has not been set up in Financials.
Common tasks
Monthly billing check. Invoices → Need Attention, then read Production Var. and Meter Var. on each row. Anything beyond your tolerance goes back to the biller before approval.
Explain a bad month to an owner. P&L Tracker with Show Expected on: the gap between actual and expected, plus the Production row above it, usually tells the story in one screen.
Audit trail for a decision. Turn on Show Comments so the reasoning recorded at the time comes with the numbers.
Common questions
Invoice Prod. and System Prod. differ.
The invoice was raised on a different figure — often the meter rather than the inverters, or a period boundary difference. Check Meter Prod. before assuming an error.
The P&L is empty.
No financial categories are configured for the site. Set them in System Settings → Financials; the tracker only reports what the model defines.
Can I edit numbers here?
The tracker reports; the model is edited in Financials, and invoices are managed in the Finance section of the portal.