
PV Systems table: summary bar, compare and full screen
The PV Systems table is where you scan the portfolio, read fleet totals and pick out the systems that need attention. This article covers the parts of the table that go beyond the basic list: the KPI summary bar, the CO2 Emissions Saved KPI, comparing selected systems, hiding the table controls, full screen, and what the table remembers between visits. For a tour of the whole page, see Fleet Management: PV Sites; for views, filters and column set-up, see Saved views, filters and columns.
What's on the table
KPI summary bar
The row of cards above the table totals the systems currently in the list. It follows the selected period and your filters, so it always describes exactly the rows below it. Filter to one customer or one vendor and the cards recalculate for that slice; change the period from Daily to Monthly and they recalculate for the month.
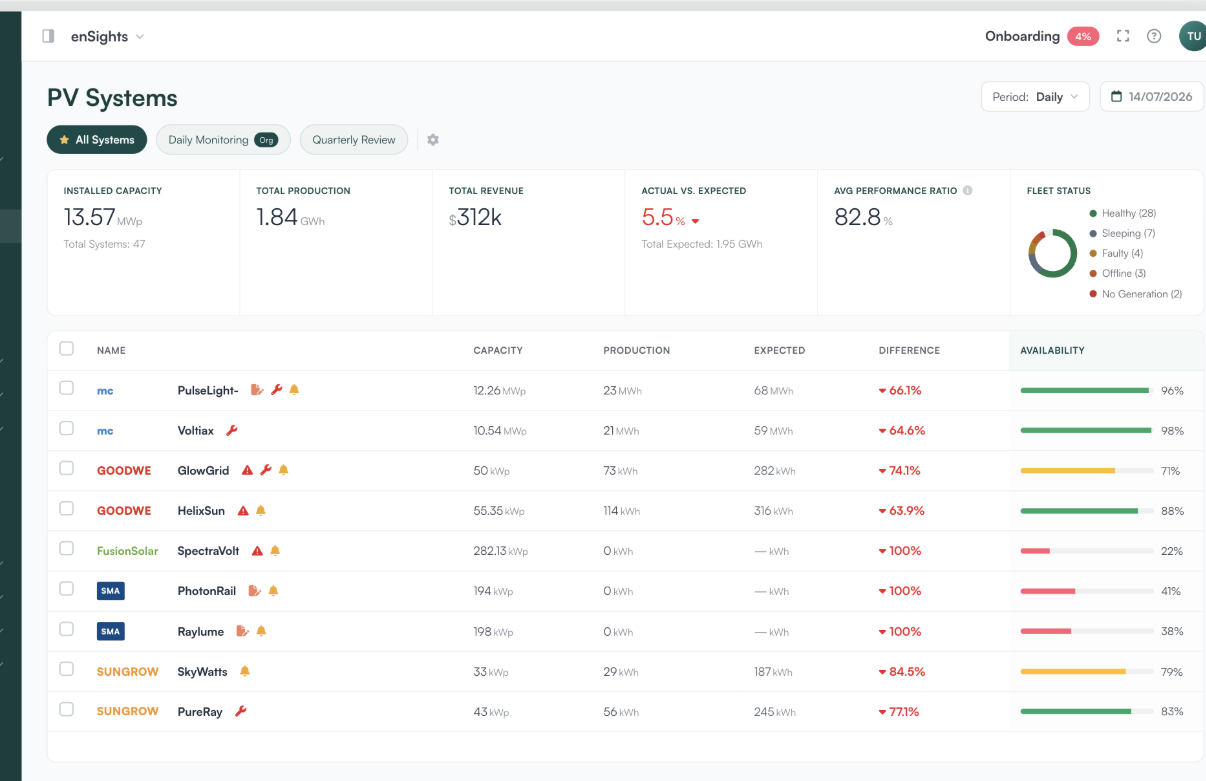
Use it to answer portfolio questions — total production this month, installed capacity for a customer, how a group is tracking against expected — without opening a report.
CO2 Emissions Saved
CO2 Emissions Saved estimates the emissions avoided by each system's production for the selected period. It is available as a table column, so you can show it per system, sort by it and include it in a saved view, and it also appears in each system’s Analysis KPI bar.
Turn the column on from Preferences (the sliders icon) if you don't see it.
How CO2 Emissions Saved is calculated
It is a fixed multiple of the system’s production for the selected period:
Unit | Calculation |
|---|---|
Kilograms | Production (kWh) × 0.392 |
Metric tonnes | Production (kWh) × 392 ÷ 1,000,000 |
0.392 kg (392 g) of CO₂ per kWh is the average emissions factor enSights applies to every system. It is the same for every site and doesn’t change by country or grid.
Example. A system produces 279.2 MWh in September: 279,200 kWh × 0.392 = 109,446 kg, which shows as 109.45 t in its Analysis KPI bar.

- Values below one tonne are shown in kilograms; above that, in tonnes.
- Because it follows production, it follows the selected period and your filters, and system values add up to the total.
- A system with no production data for the period shows it as not available rather than zero.
- The Dashboard’s Equivalent Trees Planted works the same way: production (kWh) × 0.0117.
Controls
Control | What it does |
|---|---|
Hide table management functions / Show table management functions | Top-left of the table. Folds the view tabs, modified-view bar, filter/search toolbar, period selector and date picker into a single summary line, and gives the space back to table rows. |
Expand icon (top bar) | Opens the table in full screen. The tooltip reads Full screen · Esc exits . |
Exit full screen · Esc | Top-right while in full screen. Returns to the normal page. |
Multiple Selection | The list icon left of the search box. Adds checkboxes to the rows so you can act on several systems at once. |
Compare | Appears once at least one system is selected. Opens the selected systems side by side in a comparison window. |
Save as Group | In the comparison window. Saves the selected systems as a group you can reuse. |
Close | In the comparison window. Closes it without saving anything. |
Next / Back arrows | In a system's detail view. Move to the next or previous system in the list without going back to the table. |
How it works
Hiding the table controls
Click Hide table management functions and the whole control block collapses to one line that still tells you where you are: the active view, how many systems are listed, the period and the date. Nothing is switched off — your filters, view and period stay applied; they are just out of the way.
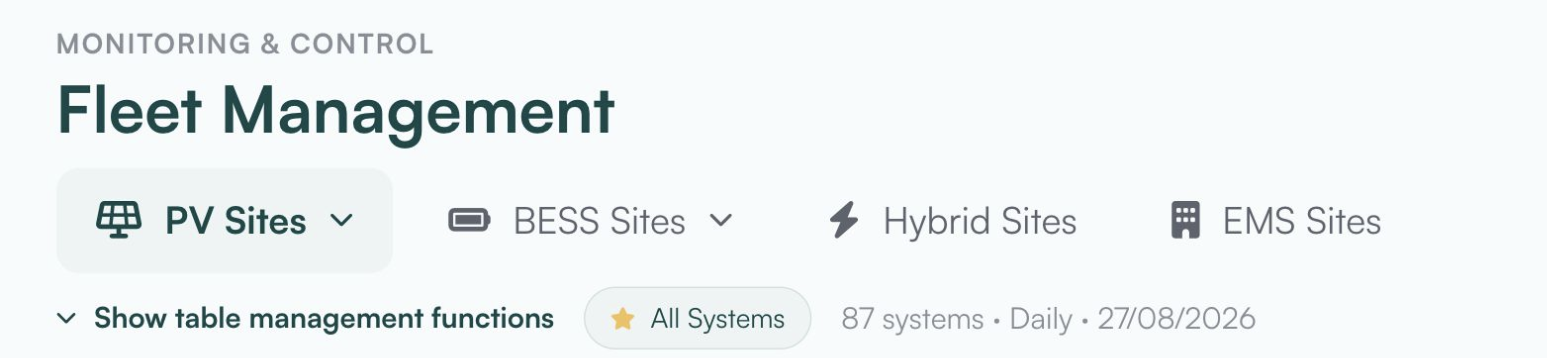
- The KPI summary bar stays visible whether the controls are shown or hidden.
- Hiding the controls never reloads the data. The rows stay exactly as they were.
- If the active view had unsaved changes, they are still there when you show the controls again.
- If a value in the summary line has nothing set (for example no date applied), it shows –. A long view name is shortened; hover it to see the full name.
- The choice is remembered per table and per user. Hiding the controls on PV Systems does not hide them on Insights or Maintenance, and it doesn't change anything for your colleagues.
The same Hide / Show table management functions toggle works identically on the other list pages in the portal.
Full screen
Full screen uses the expand icon in the top bar — there is no second full-screen button inside the table controls. In full screen the page title and the active tab stay visible so you know which list you're looking at.
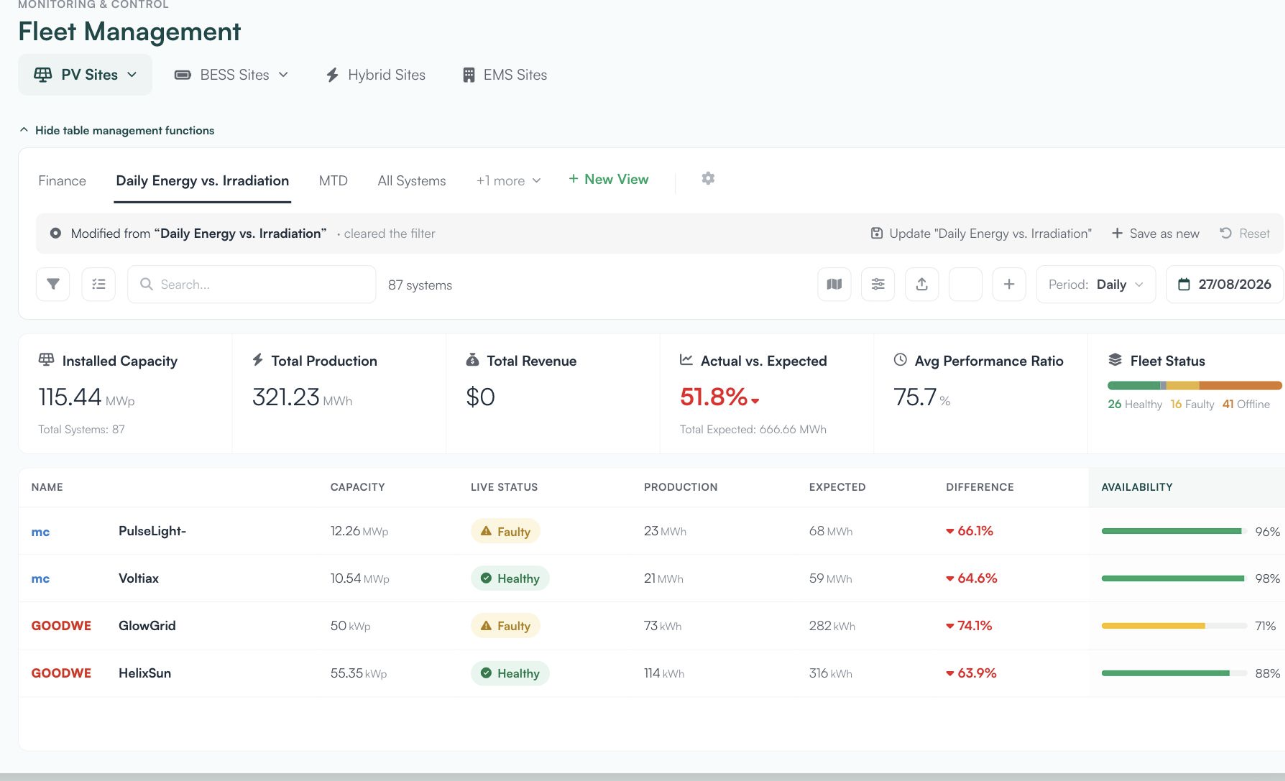
Full screen and hidden controls are independent. Use both together for the largest possible table: full screen, then Hide table management functions. Press Esc to leave full screen; you return to the same scroll position you left.
Comparing systems
Select the systems you want with Multiple Selection and click Compare. The comparison window shows the selection as a temporary group, with a normalized production graph for each system and the group average — the same comparison you get from a saved group. Normalized production puts systems of different sizes on the same scale, so a 50 kW rooftop and a 2 MW ground mount can be read against each other.
The group is temporary. Close discards it. Save as Group asks for a name (a suggested one is filled in), and the saved group then appears with your other groups and in the Groups filter. Saved groups follow the same visibility and permission rules as groups created anywhere else.
What the table remembers
- Column widths you drag stay as you left them next time you open the table.
- Column order applies to the whole table, including when rows are grouped — reordering in one group reorders every group.
- The selected date stays the same when you switch between tabs of a system's detail view (for example from Insights to Analysis), so you don't have to pick it again.
How to
Read portfolio totals for one customer
- Open the filter panel and select the customer.
- Set the period — for example Monthly and the month you're reporting on.
- Read the KPI summary bar. It now totals only that customer's systems for that month.
Scan the whole fleet on one screen
- Set up the filters, view and period you need.
- Click the expand icon in the top bar to go full screen.
- Click Hide table management functions. The summary line confirms the view, system count, period and date still applied.
- Press Esc when you're done.
Find out why one system in a group is lagging
- Turn on Multiple Selection and tick the systems you want to compare.
- Click Compare and look for the line that sits below the group average on the normalized production graph.
- If you'll want this set again, click Save as Group and give it a name; otherwise click Close.
Walk through systems one by one
- Filter and sort the table into the order you want to review — for example worst Actual vs. Expected first.
- Open the first system.
- Use the Next arrow to move through the list without returning to the table each time.
Notes
- The KPI summary bar reflects the filtered list, not the whole portfolio. If a total looks low, check the filter counter and the period before anything else.
- Compare only appears while Multiple Selection is on and at least one row is ticked.
- Closing the comparison window saves nothing. Only Save as Group creates a group.
- Esc only leaves full screen when no dropdown, dialog or date picker is open. If nothing happens, close the open menu first.
- Hiding the controls is a personal, per-table setting. It is not part of a saved view, so sharing a view doesn't hide the controls for anyone else.