
FTM Sites
Monitoring & Control → FTM Sites
Availability: FTM Sites appears only for tenants with the front-of-the-meter module enabled. If you do not see it in the menu, your organisation does not have it.
What an FTM site is
A front-of-the-meter site sells into a market rather than to a site load. That changes the daily rhythm: for every trading day someone must submit a generation plan before gate closure, the site must follow it, and the difference between plan and delivery has a financial consequence.
This page is built around that cycle rather than around performance monitoring.
The site list
- Site Name.
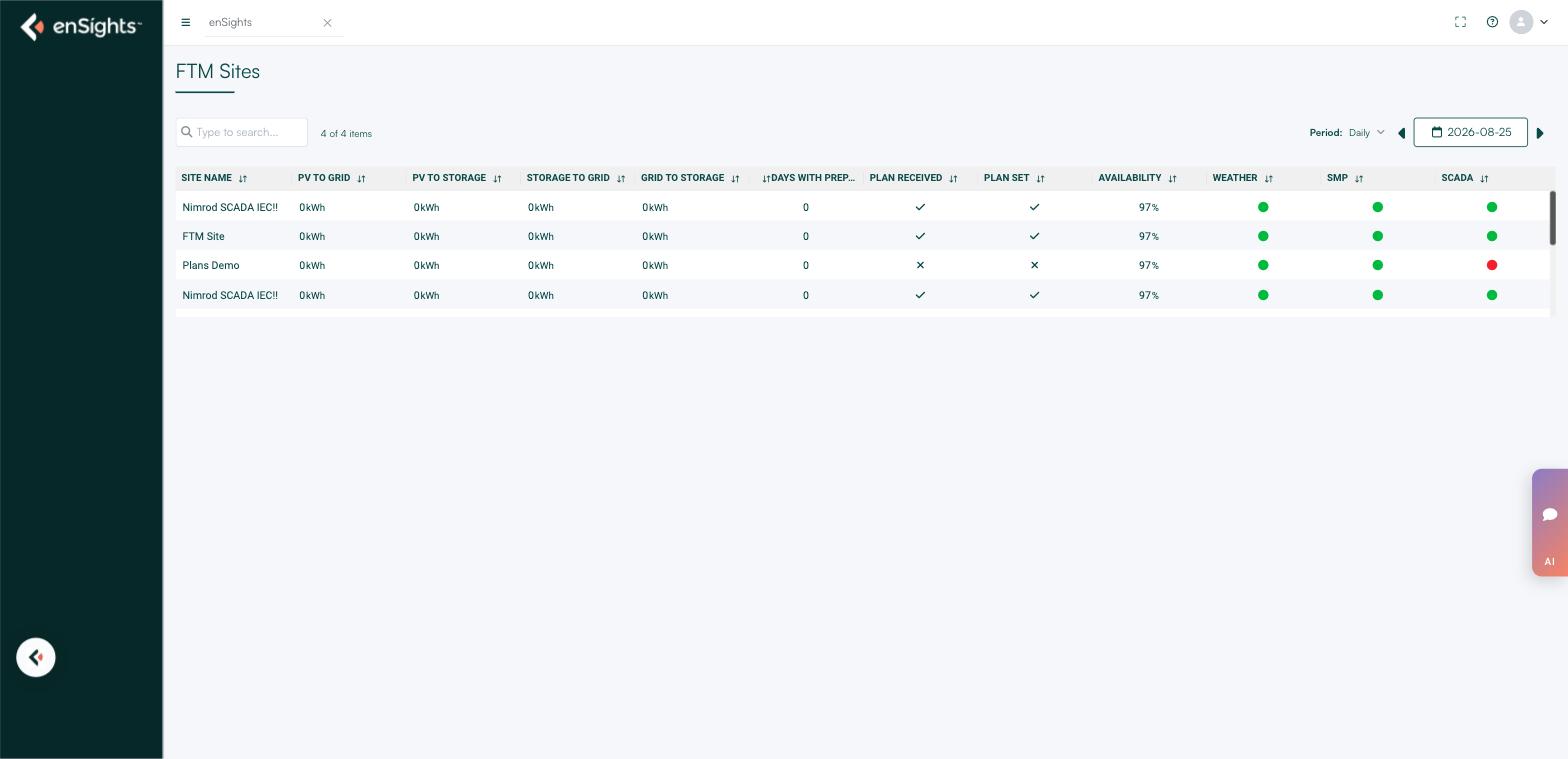
- PV to Grid, PV to Storage, Storage to Grid, Grid to Storage — the four energy flows for the period, which describe what the site actually did.
- Days with Prepared Plans — how far ahead the site is covered. This is the column to watch: a site at zero has nothing submitted for tomorrow.
- Plan Received and Plan Set — ticks or crosses for the two halves of the cycle: a plan arrived, and a plan was pushed to the site.
- Availability — the site's availability for the period.
- Weather, SMP, SCADA — traffic lights for the three feeds the cycle depends on: weather forecast, market prices and the site's own control link. A red light explains a missing plan faster than anything else on the page.
Search and the period control work as elsewhere.
Inside a site
Clicking a site opens a workspace with ten tabs: Dashboard, PV System, Storage, Policies, Insights, Maintenance, Documents, Cash Flow, Operations Control and Diagnostics.
Dashboard
Three cards across the top:
- Generation Plan — the planned PV, PV To Export, Grid To Storage and Storage To Grid for the day.
- SMP — system marginal price from the market operator (NOGA in Israel), with Peak and Off-Peak prices and the day's price curve. This is the input that decides when it is worth exporting.
- Weather — temperature and irradiance, the basis of the production forecast the plan is built on.
Below, the plan itself in Graph View or Table View, with a selector between the editable Generation Plan and the read-only Loading Plan. When a day has nothing yet the page says so plainly — No Generation Plan Found. Try to import a plan or copy a plan from another date — and Copy other plan to here is the quickest fix for a typical day.
The right rail carries the operational state: a countdown in days, hours and minutes to the next submission deadline, Update Site to push the plan, import and export buttons for plan files, Days with prepared plans, an Audit trail of changes, an Open Alerts donut split High / Medium / Low with repetitive alerts called out, and Availability.
PV System
The generation view: a summary line with energy, revenue, meter energy and normalised versus expected; a System / Inverters / Meters selector; metric chips including AC Power, Meter Power, PPC and POA Irradiance at 15-minute granularity; and a Benchmark with a radius slider that compares the site against others within a chosen distance. The Energy Losses waterfall appears once the day is complete — it is generated only after all daily data is received.
Storage
The same layout as a battery's analysis page — capacity, energy imported and exported with costs, profit, RTE and availability, plus the live-data rail — with a SEND action for sharing.
Operations Control
The controllable devices at the site, listed as Name, Vendor, SN, Mode and Status, with + to add one. Mode is what each device is currently doing under control.
The remaining tabs
Policies, Insights, Maintenance and Documents behave as they do elsewhere in the portal. Cash Flow holds the financial result of the site's trading, and Diagnostics the device-level checks.
Common tasks
Daily plan check. Sort the list by Days with Prepared Plans ascending and work through anything at zero before gate closure. Check the Weather, SMP and SCADA lights on the same row.
Build tomorrow's plan quickly. Open the site → Dashboard → Copy other plan to here from a comparable day, adjust in Table View, then Update Site.
Explain a deviation. Compare the plan with the PV System tab's actuals for the same day, and read the Energy Losses waterfall once the day is closed.
Check who changed what. The Audit panel on the Dashboard rail.
Common questions
The plan was not submitted.
Check the countdown (was it past gate closure), the SCADA light (could the site be reached) and the Audit panel (was a plan ever set).
SMP shows no prices.
The market feed is unavailable — the SMP traffic light on the list will be red. Plans can still be built, but not optimised against price.
Why is the Energy Losses waterfall empty?
It is produced only after the day completes and all data has arrived.