
System Settings: General, Advanced and Performance
Fleet Management → PV Sites → a system's ⋮ menu → Edit
System Settings is the site's configuration, organised into seven tabs down the left: General, Advanced, Performance, Integrations, Financials, Alerts Management and Products & Warranties. This article covers the first three. Fields marked * are required, and nothing is committed until you press Save.
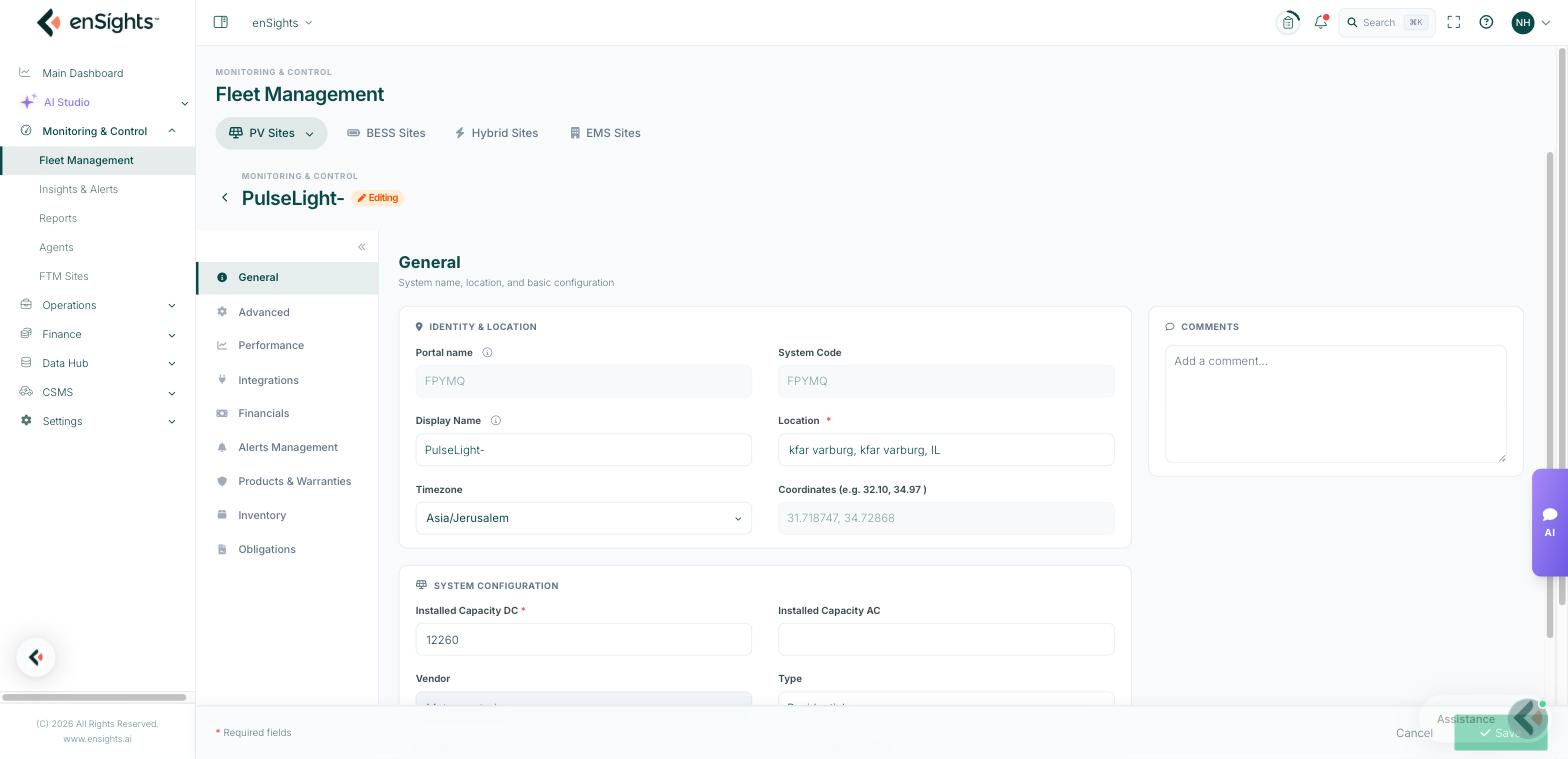
General — identity and location
Identity & Location
- System Code — assigned by the portal, read-only.
- Display Name * — the name used everywhere. Keep a naming convention; this is what your team searches on.
- Location * — a place search. Choosing a place fills the coordinates.
- Timezone — drives daily boundaries and alert windows.
- Coordinates — latitude, longitude. These feed the weather and irradiance services, so precision matters for expected values.
System Configuration
- Installed Capacity DC * and Installed Capacity AC — the DC array and the AC limit. The pair is what makes clipping visible, and DC capacity is what inverter comparisons are normalised by.
- Vendor * — the monitoring platform the data comes from.
- Type — Residential, commercial and so on; used for grouping and benchmarking.
- Installation Date — the anchor for degradation.
- Warranty Expires On.
- System Reference ID — the identifier on the vendor side, used to match the site to its source.
- Utility Contract / GATS System ID — the identifier used for utility or certificate registries.
Advanced — behaviour and data sources
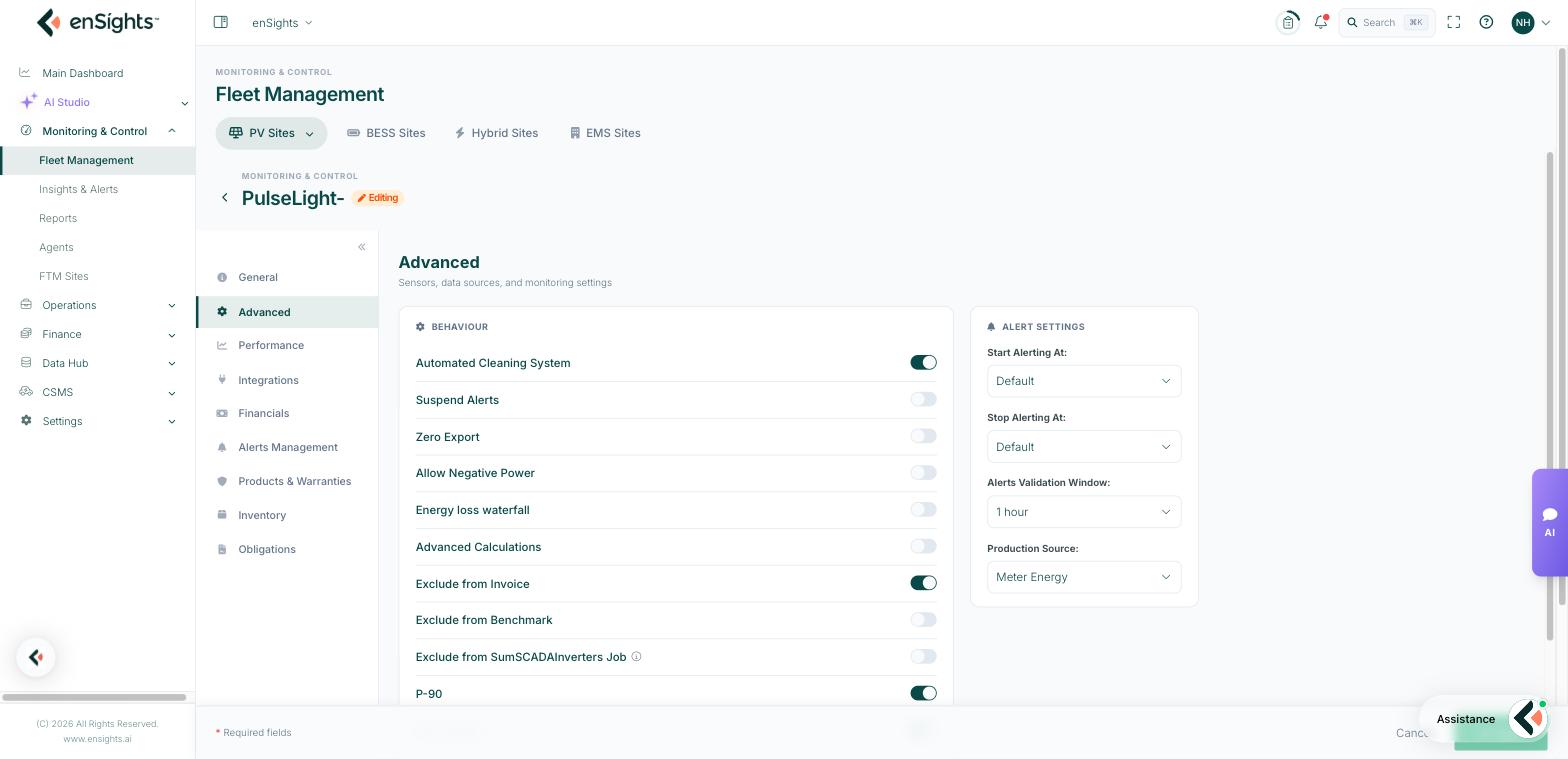
Behaviour
- Automated Cleaning System — the site has robotic cleaning; also shown as an icon on the fleet list.
- Suspend Alerts — stop alerting for this site. The right switch during a long outage or construction; remember to switch it back.
- Zero Export — the site is not allowed to export, so export readings are treated accordingly.
- Allow Negative Power — permit negative values instead of clamping them, which some meters need at night.
- Exclude from Benchmark — keep an atypical site out of peer comparisons so it does not distort its neighbours.
- Exclude from SumSCADAInverters Job — do not build the site total by summing inverters.
- Basic Revenue Calculation — use the simple income-per-kWh calculation rather than the full financial model.
Sensors & Data Sources
- On-site irradiance sensor (POA) — the site has its own plane-of-array sensor. This is the preferred input for weather-adjusted expectations.
- Temperature External Service — take temperature from a weather service rather than the site.
- External weather data — Off, Full Weather Data or GHI + Solar Radiation. The on-screen note is the important part: Full Weather Data overrides the on-site sensor POA with weather-service data. GHI + Solar Radiation keeps the on-site POA. Choose Full Weather Data only when you do not trust the sensor.
- Weather Forecast — enable forecast data for the site.
Alert Settings
- Start Alerting At / Stop Alerting At — the daily window in which alerts may fire. Defaults follow daylight; widen them for a site with unusual hours.
- Alerts Validation Window — how long a condition must persist before it becomes an alert (for example one hour). Raising it is the standard cure for flapping alerts.
- Production Source — Inverter Production or meter energy. This single setting decides which figure the Production column, the reports and the invoices use.
Performance — what "expected" means
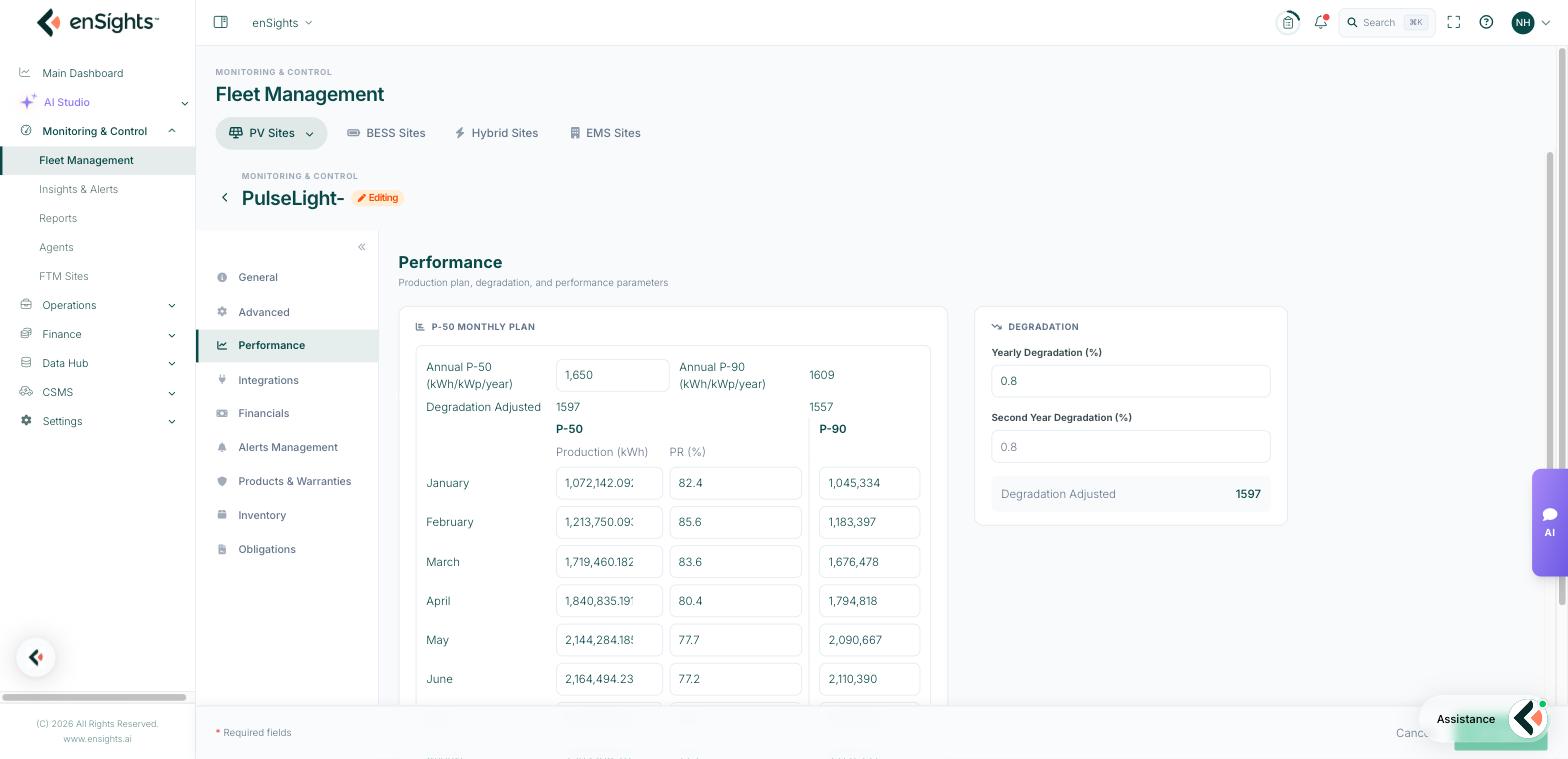
P-50 Monthly Plan
The twelve-month production plan. Enter the Annual P-50 (kWh/kWp/year) or the monthly production and PR figures; the page totals them and shows the system total and PR beneath. This plan is what every Expected Production and Actual vs. Expected number in the portal is measured against — including the weather-adjusted metrics, which take their monthly coefficient from here.
Degradation
Yearly Degradation (%), Second Year Degradation (%) and the resulting Degradation Adjusted value. Together with the installation date they age the plan, so a ten-year-old site is not judged against its first-year expectation.
Performance Parameters
The physical model of the site, used for loss analysis and PR: Inverters Capacity DC/AC, Panel Model, Tilt, Azimuth, Site Area, and the loss factors — Natural Soiling, Module Mismatch, Wiring Mismatch, String Mismatch, Module Quality Loss, LID, Inverter Efficiency, Inverter Auxiliaries, Inverter AC Ohmic, Inverter External XFM and Power Factor.
You do not need every field to get value from the portal — but the more of the model you complete, the more the loss waterfall and PR figures can attribute a shortfall to a cause rather than just reporting it.
Common tasks
Stop alert noise from a site under construction. Advanced → Suspend Alerts on. Add a reminder to turn it off.
Switch billing to the new meter. Advanced → Production Source → meter energy. For many sites at once, use the bulk action on the fleet list.
Fix expectations that are obviously wrong. Performance → check the twelve monthly values and the units, save, then run Recalculate Weather Adjusted from the site's ⋮ menu.
Tame a flapping alert. Advanced → raise Alerts Validation Window instead of switching the rule off.
Common questions
Which setting should I check first when numbers look wrong?
Production Source, then the P-50 plan, then timezone and coordinates. Those four explain most surprises.
Will Full Weather Data improve my expected values?
Only if the on-site sensor is unreliable. It overrides the sensor entirely, which is a downgrade when the sensor is good.
I changed the plan but the site still shows the old expectation.
Save, then recalculate the weather-adjusted figures from the fleet list's row menu; historical values are not rebuilt automatically.