
Insights & Alerts
Monitoring & Control → Insights & Alerts
What this page is
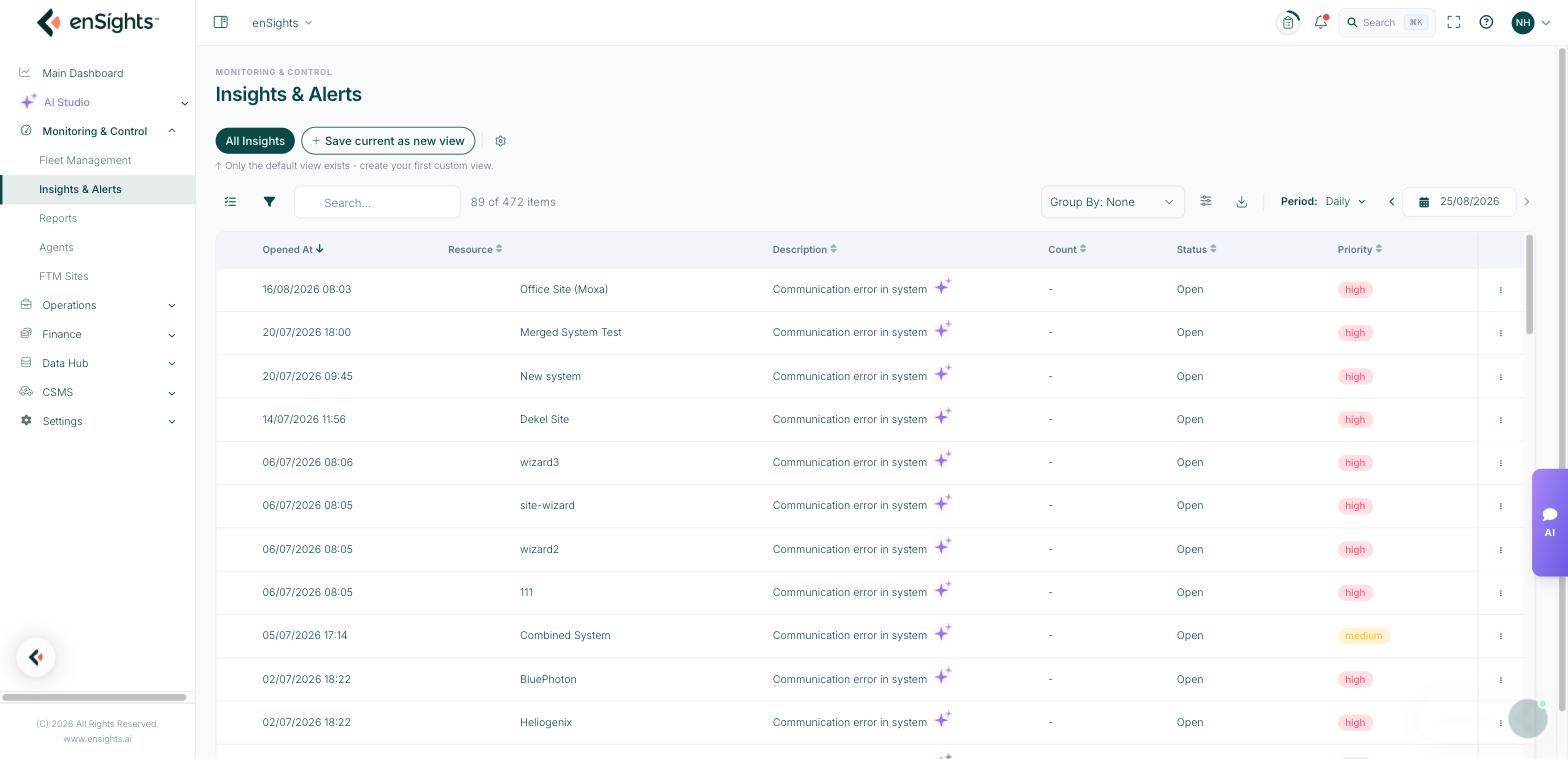
Every alert rule that fires anywhere in the fleet lands here. It is the work queue for the monitoring team: one row per condition, newest first, with the tools to triage, assign and silence.
Reading a row
- Opened At — when the condition was first detected, not when you noticed it.
- Resource — the asset, with its vendor logo. Crucially, this is the level the alert was raised at: a system, an inverter, a string, a tracker or the storage. Click it to open the asset.
- Description — the rule's wording. This is the Display Description from the rule, so it can be customised per site.
- Count — recurrences of the same condition. High counts mean a chronic problem; use the Expand chevron to see the occurrences.
- Status — Open, Closed or Dismissed.
- Priority — the severity set on the rule: high, medium or low.
Additional columns are available in Preferences, and three of them change how the queue is worked: Duration and Reported Duration (how long the condition has been live), SLA, and Energy Loss — the estimated energy the condition has cost, which is the honest way to rank alerts when everything looks urgent. Affected Capacity, Customer and contact columns help when you need to notify someone.
Filtering the queue
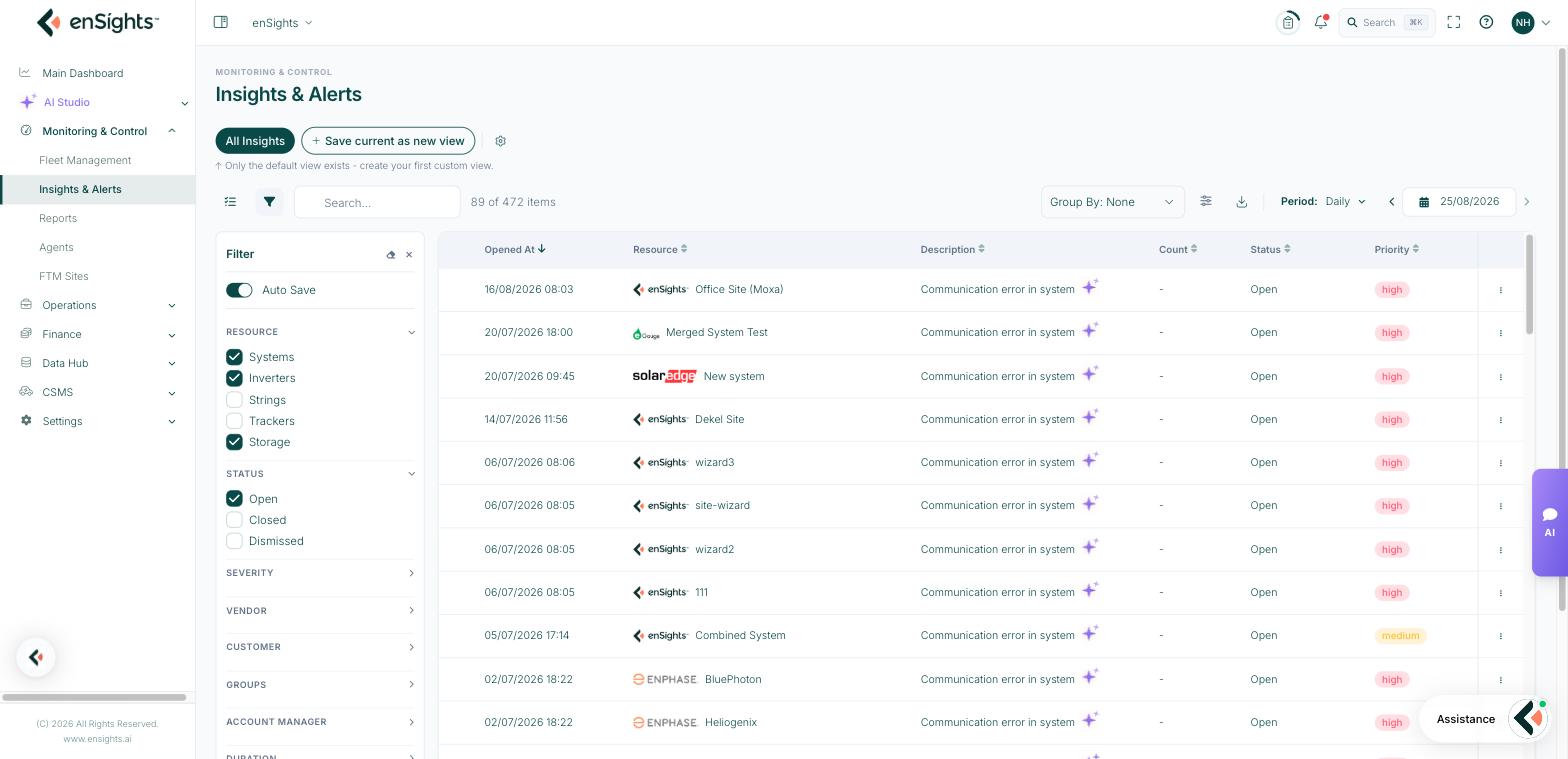
The filter panel is built for triage:
- Resource — Systems, Inverters, Strings, Trackers, Storage. Narrowing to Inverters is how you get from "the fleet has 400 alerts" to "twelve inverters need attention".
- Status — Open, Closed, Dismissed.
- Severity — High, Medium, Low.
- Vendor, Customer, Groups, Account Manager — slice by who owns or manages the assets.
- Duration (days) — everything older than N days, which is where the neglected problems hide.
- Alerts — pick specific alert types.
- Exceeded from SLA — Exceeded from SLA and Beyond SLA by, for reporting against response commitments.
- Miscellaneous — Hide Insights with Service Call Open (hide what is already being worked on) and Show Internal Alerts (include the rules marked internal).
Group By adds structure: Dates, Type or Priority. Grouping by Type answers "what is wrong with this fleet"; by Priority, "what do we do first".
Acting on an alert
The row menu offers:
- New Service Call — turn the alert into maintenance work, carrying its context.
- Add Comment… — record what you found or decided. Comments are the institutional memory of a recurring fault.
- Dismiss 24h / Dismiss 3 days — silence a known condition temporarily. It returns if still true.
- Close — declare it resolved.
The habit worth building: dismiss what you understand and are waiting on, close what is genuinely fixed, and comment on anything a colleague will meet again.
Where alerts come from
Nothing on this page is configured here. Each row traces back to a rule in a system's Alerts Management settings — its threshold, severity, delay, SLA and recipients. If the queue is too noisy or too quiet, that is where the fix belongs; see System Settings: Alerts Management.
Common tasks
Daily triage. Filter Status → Open and Severity → High; group by Priority; work top down, raising service calls as you go. Save it as a view so it is one click tomorrow.
Rank by what it costs. Add the Energy Loss column and sort descending — the expensive problems, not just the loud ones.
Find neglected alerts. Filter Duration → more than 7 days, and Miscellaneous → Hide Insights with Service Call Open. What remains is old and unowned.
Report on SLA. Filter Exceeded from SLA, add the SLA and Duration columns, and export.
Prepare a customer call. Filter by Customer, group by Type, and export the list.
Common questions
The same alert appears again after I closed it.
Closing records a resolution; the detector reopens the alert if the condition is still true. Dismiss instead while you wait for a fix.
An alert I expect is not in the list.
Check the Status filter (it may be dismissed), whether it is an internal rule (Show Internal Alerts), and whether the site has Suspend Alerts switched on.
Count says 40 — is that forty problems?
No: it is the same condition recurring forty times. Treat it as one chronic fault.