
EMS site: Overview
Fleet Management → EMS Sites → click a site → Overview
An EMS site's workspace opens on a set of tabs — Live, Overview, PV System, Storage, Policies, Insights, Maintenance, Meters, Controller, Documents and Diagnostics, with extra tabs such as Weather Sensors appearing where the site has the hardware. Overview — previously called Dashboard — is the one to open first: it shows whether the site is doing what its policies say it should.
The KPI cards
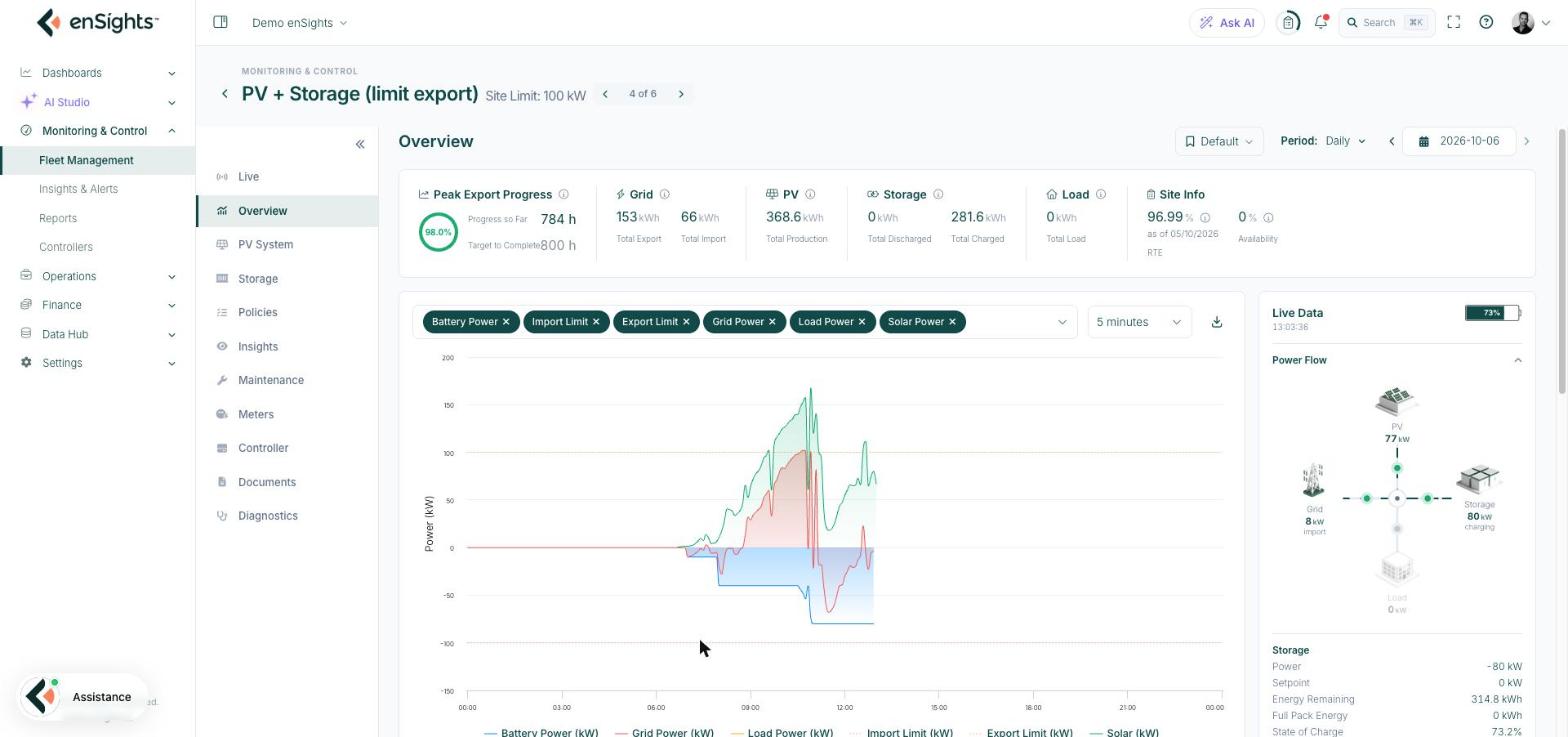
- Peak Export Progress — a progress ring with Progress so far and Target to Complete. Where a site is contracted to deliver a peak-export commitment, this is how far through it is. Each card carries an info icon explaining its own calculation.
- Grid — Total Export and Total Import for the period.
- PV — Total Production.
- Storage — Total Discharged and Total Charged.
- Load — Total Load consumed on site.
- Profit — the financial result of the period's trading.
- Site Info — RTE and Availability for the site as a whole.
Hover a KPI to follow the energy
Every energy card now explains itself: hover it and a tooltip breaks the period's energy down into where it came from and where it went to. The header gives the card's net position — for example Grid — Net export 87 kWh — and the two sections below split the totals by source and destination, each with its energy and its share.
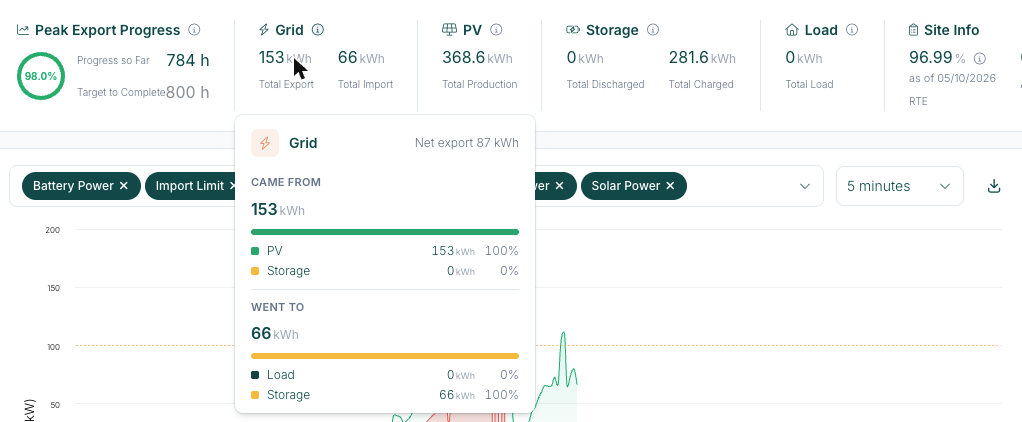
The percentages are shares of that card's own total, which makes the common support questions one hover each: if Grid export reads PV 100%, every exported kilowatt-hour was solar; if Grid import reads Storage 100% under Went to, the energy bought from the grid only charged the battery. You can read the whole energy distribution of the site — production, self-consumption, charging and export — from the tooltips alone, without building a chart.
The chart
The chip field builds the plot from the site's controllable quantities: Battery Power, Import Limit, Export Limit, Grid Power, Load Power and Solar Power. Granularity defaults to 5 minutes, and the download icon exports what is plotted.
This combination is deliberately chosen: with solar, load, battery and grid on one axis you can read the site's whole energy balance, and with the two limit lines you can see whether the EMS is holding the site inside its constraints. A grid curve pressed flat against the export limit is the EMS working correctly; a curve crossing it is a problem worth escalating.
Live Data rail
The right-hand rail is the present state, refreshed independently of the period. The Power Flow diagram at its top has its own article — EMS site: Power Flow. Below it:
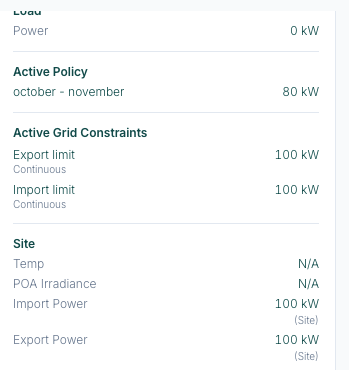
- Active Policy — the policy the controller is executing right now, with its name, its setpoint, the months it runs and today's active window (for example morning charge, 10 kW, Jan → Dec, Today 07:00 → Today 13:00). N/A means nothing is being enforced, which is the first thing to check when a site is idle.
- Active Grid Constraints — the Export limit and Import limit currently enforced at the connection point, each marked Continuous or with its time band.
- Storage — Power, Energy Remaining, Full Pack Energy, State of Charge, Voltage, Frequency.
- PV — Total Inverters Power.
- Grid — Power at the connection point.
- Load — Power consumed on site.
Saved views and period
The bookmark control saves a chart configuration, and the period control (Daily, Monthly, Yearly, Custom) drives every KPI card and the chart, exactly as elsewhere in the portal.
A note on the Live tab
The Live tab is the real-time equivalent of this page, built for watching a site during commissioning or a grid event. On a site that has never reported it may not render, because there is no last-known state to draw. If you see an error there, the Overview still works — and the cause is almost always that the controller has not yet connected. Check Controller.
Common tasks
- Confirm the EMS is in control. Read Active Policy in the Live Data rail — the months and hours shown under it tell you whether its schedule covers right now. If it is N/A, open Policies and check that a policy is active.
- See the energy distribution at a glance. Hover the Grid, PV, Storage or Load KPI and read the came-from / went-to split — the fastest answer to "did the battery charge from solar or from the grid?".
- Check the site respected its limit. Plot Grid Power with Import Limit and Export Limit for the day.
- Trace the energy over time. Plot Solar Power, Load Power, Battery Power and Grid Power together: production, self-consumption, storage and the residual to or from the grid.
- Report on a peak commitment. Peak Export Progress plus the Grid card, with the period set to the commitment window.
Common questions
Everything reads zero or N/A.
The site is probably still Pending on the EMS Sites list — defined but not yet exchanging data with a controller.
Profit is shown but no prices are configured.
Profit uses the site's tariff and market inputs. Where those are missing, treat the number as indicative and check the financial setup.
The battery is not charging even though there is surplus solar.
Look at Min/Max SoC on the active policy and at the schedule blocks — a policy that only charges in defined hours will ignore surplus outside them. The Active Policy entry in the rail shows today's window, so you can see at a glance whether now is inside it.