
From an alert or insight to the right graph
When you investigate an alert, you want the graph for the component that raised it, on the day it happened, with the channels that actually have data. This page explains how enSights takes you there from an alert, an insight or a service call, and how the channel list tells you what is worth plotting. It is for monitoring, O&M and asset management users who move between alerts and graphs every day.
What it does
- Click an alert, land on the graph. Clicking an alert in a system's Insights tab, or a row in the Insights & Alerts table, opens the system's Analysis graph already focused on the component that raised it, with the relevant channel selected, on the alert's date.
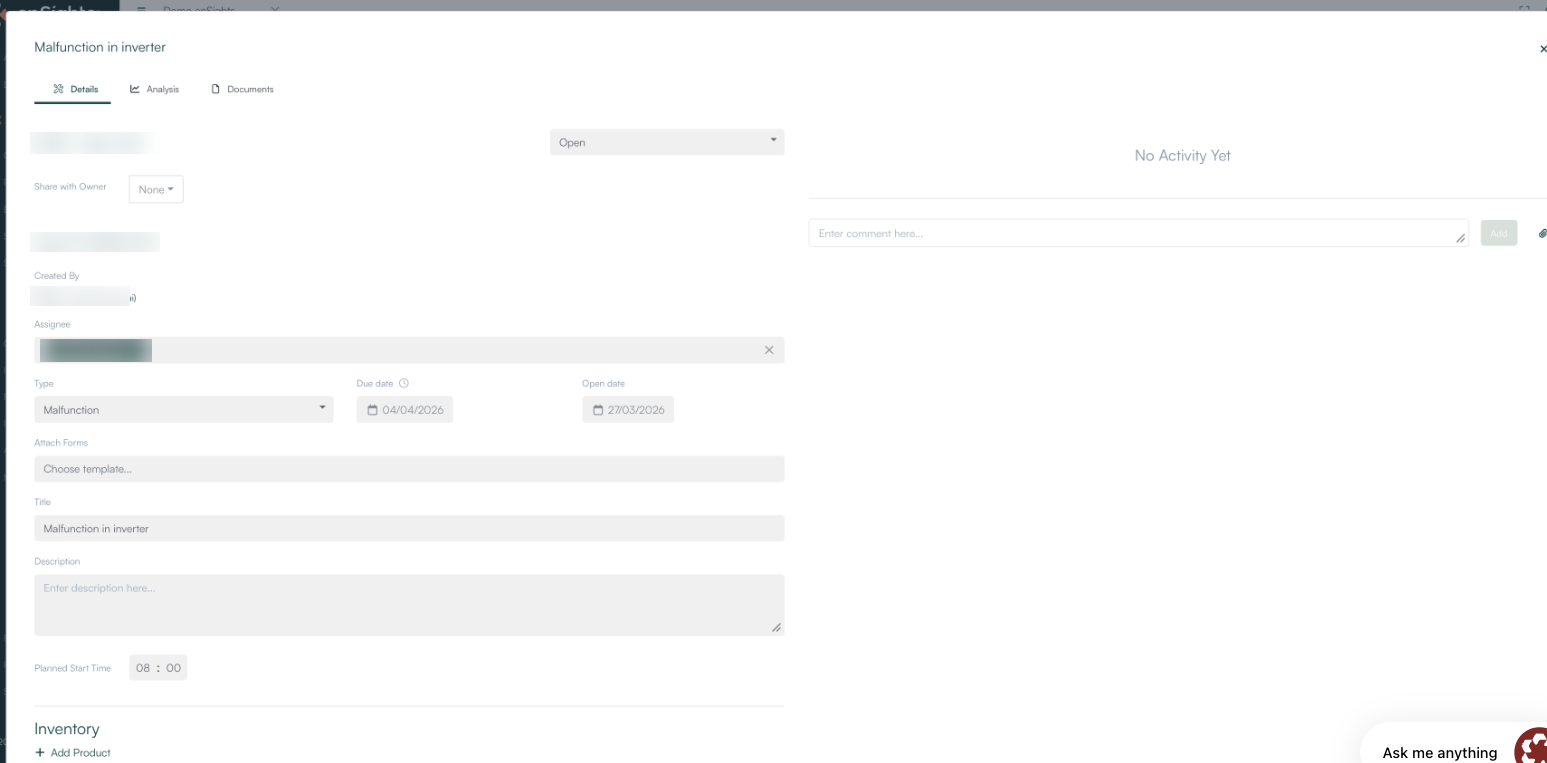
- The same from a service call. If a service call was opened from an alert, the Analysis tab inside that service call takes you to the same graph: the originating alert's component, channel and date.
- One date for the whole system card. The date selector sits above the tabs and applies to every tab in the system card. Switching tabs keeps the date.
- Channels that know whether they have data. In every graph with a channel selector, channels with no recorded data are greyed out and cannot be selected. Channels with data show an info icon with their first and last reading.
How it works
What the graph opens on
The graph opens on the component named in the alert, not on the whole system. For example, a low performance alert on Inv 1.1 opens the graph on Inv 1.1 only, with AC Power selected, on the day of the alert. From there it is a normal graph: add channels, add other inverters or change the date as you usually would.
The shared date
Because the date selector belongs to the system card rather than to a single tab, the date you land on from an alert stays in place while you check the other tabs. Change the date and every relevant tab updates to it. This matters most for historical alerts: you can open an alert from weeks ago, look at the graph, then check the other tabs for the same day without going back to the alert to remember when it happened.
Available and unavailable channels
What you see | What it means |
|---|---|
Channel in full colour | At least one reading exists for this channel on this device or system. You can select it. |
Channel greyed out, checkbox disabled (or greyed in a dropdown) | No readings have ever been recorded for this channel on this device or system. Hover it to see why it is disabled. You cannot select it. |
Info icon next to a channel | Hover to see First reading and Last reading , with date and time, for that channel. |
This applies to PV system graphs, site graphs, BESS graphs and any other time-series graph with a channel selector, for both raw device channels (meter, inverter, BESS) and calculated parameters.
What "available" does and does not tell you
- Available is not the same as "has data today". A channel counts as available if it has ever recorded a reading. A channel that reported for a few weeks two years ago is still available. Check the info icon: if the Last reading is long ago, an empty graph for this week is expected.
- The first and last reading are per channel. They describe that one channel, not the device or the system. Two channels on the same inverter can have very different ranges.
- The range ignores the date you have selected. The info icon always shows the channel's full history, whatever period the graph is on.
- Gaps are not shown. The first and last reading tell you the outer range only. A channel can still have gaps inside that range.
- Greyed-out channels are shown on purpose. They are not hidden, so you can see what the device could report even when it does not.
How to
Investigate an alert on the day it happened
- Open the system and go to the Insights tab, or find the alert in Monitoring & Control → Insights & Alerts.
- Click the alert. The Analysis graph opens on the component that raised it, on the alert's date, with the relevant channel selected.
- Add comparison channels or neighbouring components to see whether the problem is local or site-wide.
- Switch to other tabs as needed. The date stays on the alert's day.
Pick up an investigation from a service call
- Open a service call that was created from an alert.
- Click the Analysis tab at the top of the service call.
- The graph opens on the alert's component, channel and date, so the technician or reviewer sees exactly what triggered the call.
Find out why a graph is empty
- Look at the channel in the selector. If it is greyed out, the device has never reported it. The problem is the data source, not the date you picked.
- If it is available, hover the info icon and compare Last reading with the period you are looking at. If the last reading is before your period, the channel stopped reporting.
- If the last reading is inside or after your period and the graph is still empty, the channel has a gap. Check the connector or raise it with support.
Notes
- The jump to the alert's component, channel and date works from service calls that were opened from an alert. It relies on the originating alert, so it only applies to those service calls.
- Because the date is shared across the system card, changing it on one tab changes it on the others. If a tab shows a different day from what you expect, check the date selector at the top.
- If a channel you previously selected has no data on the system you switch to, it is deselected. Switching between systems updates the channel list without reloading the page.
- If availability information cannot be loaded, every channel is shown as selectable, as before, so you can still plot. A small indicator shows that availability could not be checked.
- First and last reading times are shown in your locale and time zone.