Global Settings: Performance
What this page is for
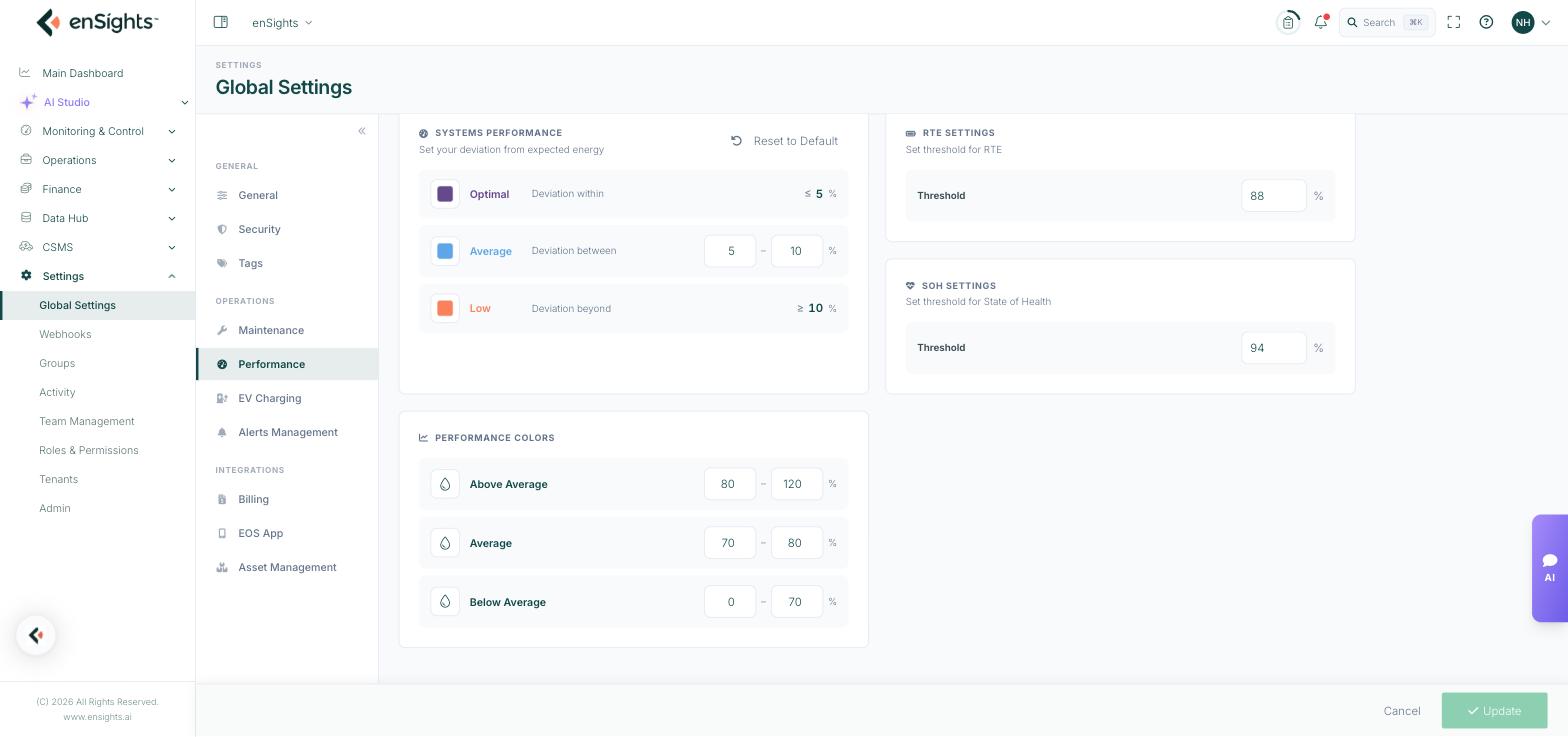
Performance defines the numeric boundaries the platform uses to judge assets. It does not measure anything — it decides where "fine" ends and "a problem" begins, and which colour a figure is painted. Every dashboard, list and status indicator that shows performance reads its bands from here.
Systems Performance
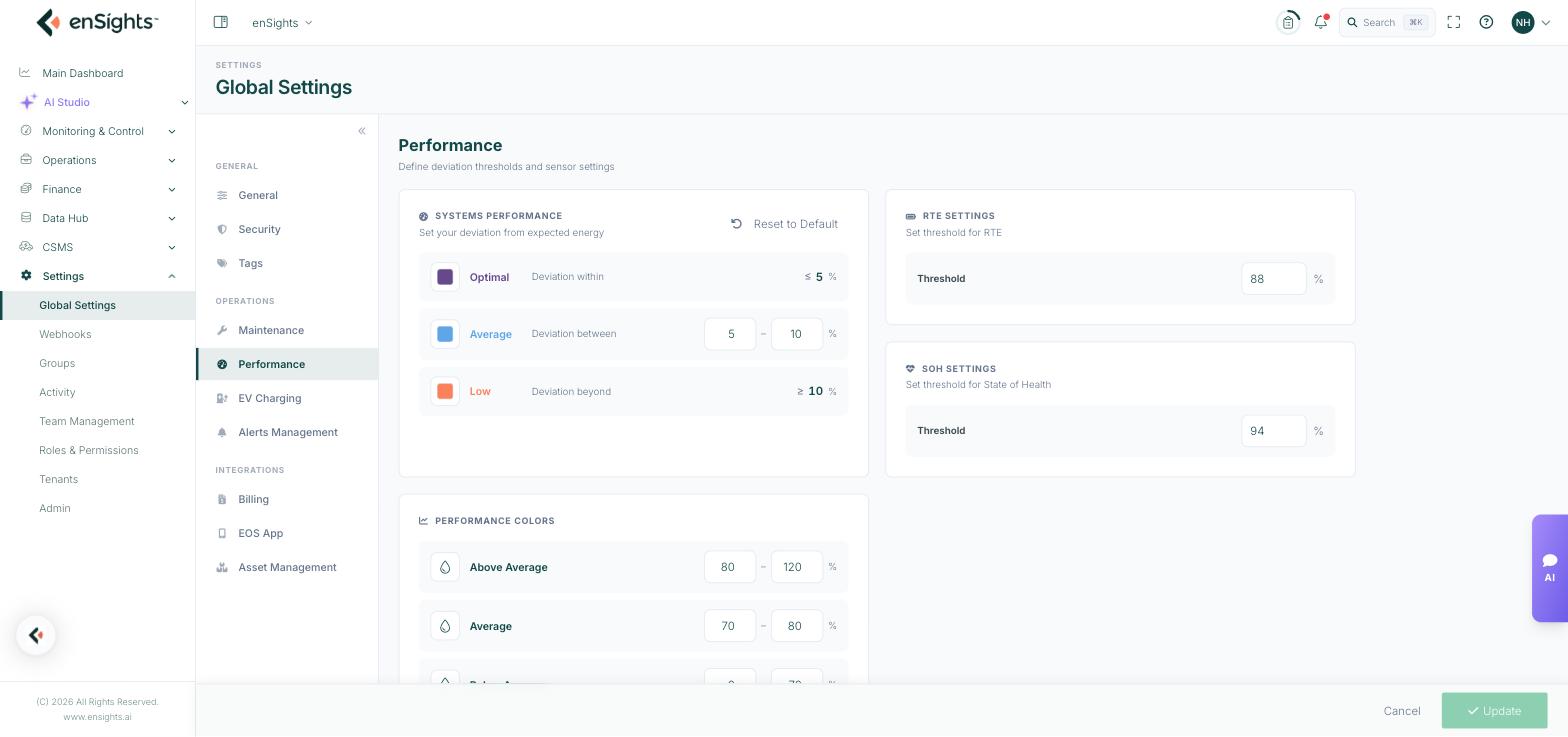
Three bands describing how far a system's actual energy may deviate from its expected energy before it is classed as underperforming. Expected energy is the weather-adjusted expectation, so these bands are about the gap between what the weather allowed and what the site produced.
Band | Rule | Default |
|---|---|---|
Optimal | Deviation within | 5% or less |
Average | Deviation between | 5% and 10% |
Low | Deviation beyond | 10% or more |
The bands are continuous: the Optimal ceiling is the Average floor, and the Average ceiling is the Low floor. Editing the Average pair therefore moves the other two boundaries with it — you set two numbers, not six. Each band also carries a colour swatch, which is what you see in system lists.
Reset to Default, at the top right of the panel, restores the shipped 5% / 10% values.
Choosing the numbers
Tight bands surface small losses early but flag ordinary measurement noise; wide bands are quiet but let real losses accumulate. A useful approach is to start at the defaults, look at how many systems land in Low over a normal week, and adjust until that population is small enough to act on but not so small that genuine losses hide inside Average.
RTE Settings
A single Threshold percentage for round-trip efficiency on battery systems — the share of energy put into a battery that comes back out again. Below this figure, the battery is treated as underperforming.
Round-trip efficiency falls naturally with age and with operating temperature, so this threshold is effectively the line at which degradation stops being expected and starts being worth investigating.
SOH Settings
A single Threshold percentage for State of Health — the battery's present usable capacity as a share of its original rated capacity. Below this figure, the battery is flagged.
Warranties and offtake agreements often specify a State of Health floor. Setting the threshold to match that figure turns a contractual obligation into something the platform watches for you.
Performance Colors
Three percentage ranges that drive the colour coding used across dashboards:
Band | Default range |
|---|---|
Above Average | 80% to 120% |
Average | 70% to 80% |
Below Average | 0% to 70% |
Each band has its own colour swatch. Note that this is a separate scheme from Systems Performance: Systems Performance is about deviation from expectation, while Performance Colors bands an absolute performance percentage. Keep the two consistent in spirit, or the same site can read green on one screen and amber on another.
How to change a threshold
- Go to Settings → Global Settings → Performance.
- Type the new value into the field. Percentages only.
- Press Update at the bottom of the page.
Notes
- Changes apply account-wide and take effect on the next evaluation — they do not rewrite alerts that already fired.
- Bands must not overlap or leave gaps. If a value is rejected, check that it sits between its neighbours.
- These thresholds classify and colour. They are not the same as the alert thresholds in Alerts Management, which decide whether a notification is sent.
- Reset to Default affects the Systems Performance panel only.