
Live Health: what each PV system status means
Live Health tells you what state each PV system is in right now: working, asleep for the night, faulty, not communicating, or online but producing nothing. Asset managers and monitoring teams use it to separate a system that has gone offline from one that is connected but has generated zero, because the two need very different actions.
Where you see it
- PV Systems table — the Live Health column shows a coloured badge for every system.
- System detail view — the same badge appears next to the system name when you open a system.
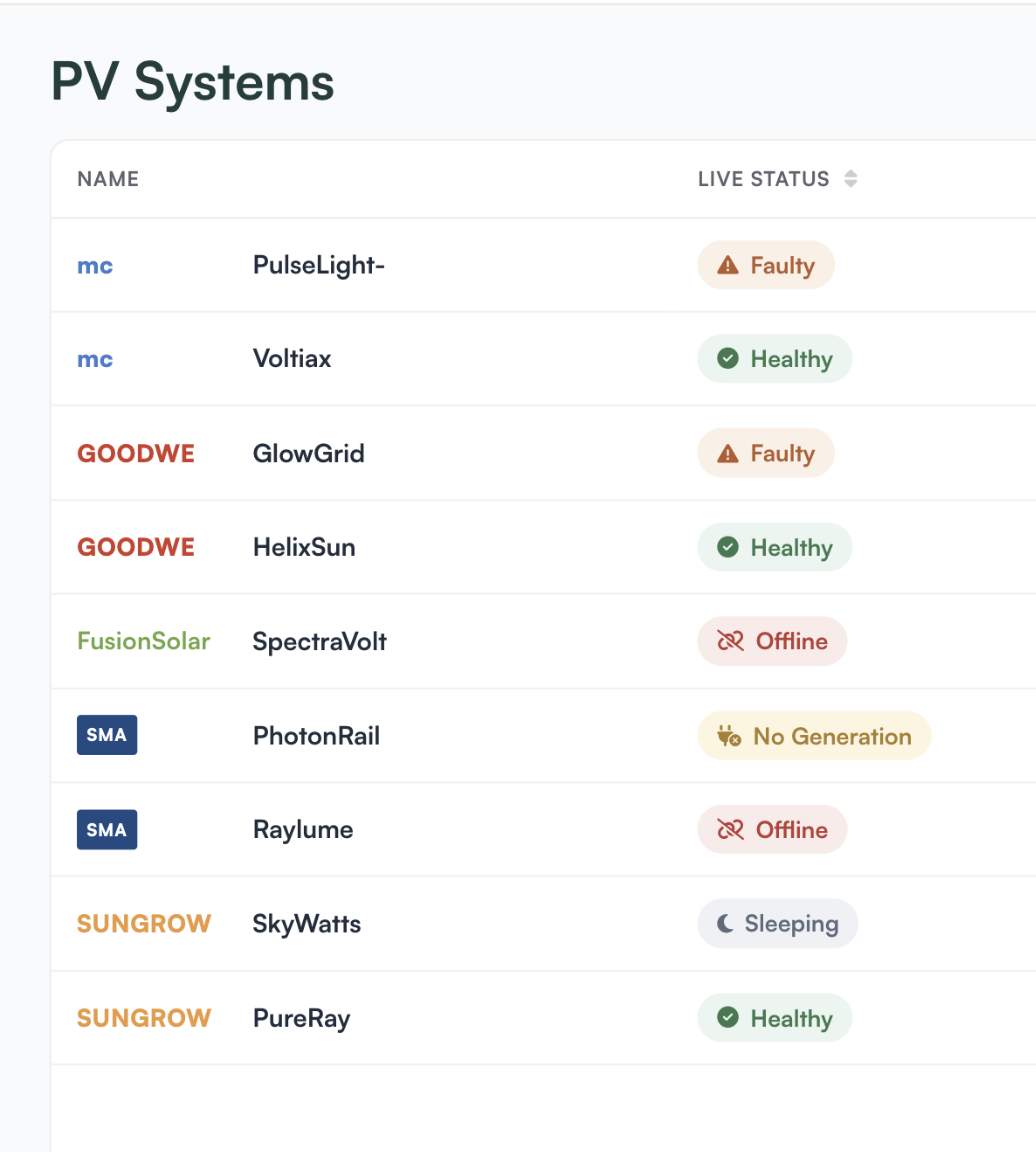
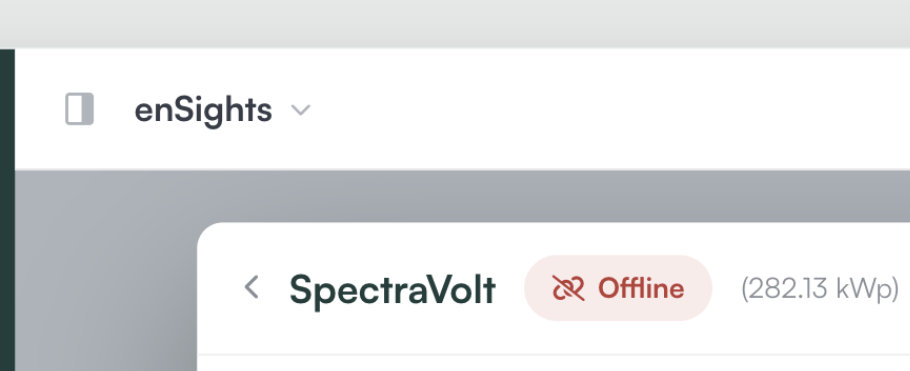
The badge looks the same and uses the same wording in both places.
What each status means
Live Health is worked out from the alerts that are currently open on the system.
Status | What it means |
|---|---|
Healthy | No open alerts on the system. |
Sleeping | The system is in a period when it isn't expected to generate, such as at night. This is normal and is not treated as a problem. |
Faulty | An alert is open that is not a no-generation, no-communication or API error alert — for example an inverter or performance alert. The system is reporting, but something needs a look. |
Offline | A No Communication or API error alert is open. enSights is not receiving data from the system, so its production for the day is unknown rather than zero. |
No Generation | A No Energy Generation alert is open. The system is communicating but producing no energy when it should be. |
When more than one applies
Every system shows exactly one status. If several conditions are true at once, the most severe wins, in this order:
- No Generation
- Offline
- Faulty
- Sleeping
- Healthy
So a system with an open inverter alert shows Faulty even at night, and a system with both a no-communication alert and a no-generation alert shows No Generation.
Live, not for the period
Live Health reflects the system's state now. It does not change when you move the period selector to last week or last month — the production columns do, the status does not. The status changes when alerts open or close: once the alert behind a Faulty, Offline or No Generation status is resolved, the system moves back to Healthy (or Sleeping, outside generating hours).
Sorting and filtering
Action | What it does |
|---|---|
Sort by Live Health | Ascending puts the healthiest systems first: Healthy, Sleeping, Faulty, Offline, No Generation. Descending puts the most severe first. |
Filter → Live Health | Select one or more statuses to show only those systems. |
Preferences (sliders icon) | Show or hide the Live Health column. |
How to
Tell offline systems apart from zero-production systems
- Open the PV Systems table and filter Live Health to Offline and No Generation.
- Treat Offline systems as a data or connectivity problem: check the logger, the network or the vendor connection. Their production is missing, not zero.
- Treat No Generation systems as a site problem: the data is arriving and shows no output, so a site visit or inverter check is usually the next step.
Put the worst systems at the top every morning
- Sort the table by Live Health, descending, so No Generation and Offline come first.
- Save it as a view (for example "Morning triage") and mark it as your favourite so the page opens on it.
Check a single system while you're in its detail view
- Open the system. The badge next to its name shows the current status.
- If it isn't Healthy or Sleeping, go to the system's insights to see which open alert is causing it.
Notes
- Live Health is additive. The Production column and every other column work exactly as before; a production value on its own still can't tell you whether a system was offline or produced nothing. Use Live Health for that.
- The status is only as current as the alerts. If an alert rule is switched off for a system, the condition it covers won't show in Live Health. Alert rules are managed in System Settings: Alerts Management.
- Sleeping uses the same expected-generation hours as the alerts, so a system isn't flagged during hours it isn't expected to produce.
- The Fleet Health bar in the KPI summary shows the same five statuses across the systems in the current list.