
Global Settings: Alerts Management
What this page is for
Alerts Management is where you decide what the platform tells you about. Every alert you have ever received traces back to a rule configured here: which condition is watched, how bad it has to be, how long it has to persist, how serious it is called, and who hears about it.
It is the highest-leverage page in Settings, and the one most worth revisiting. Too loose and real faults sit unnoticed inside the noise; too tight and the team stops reading alerts at all.
Layout
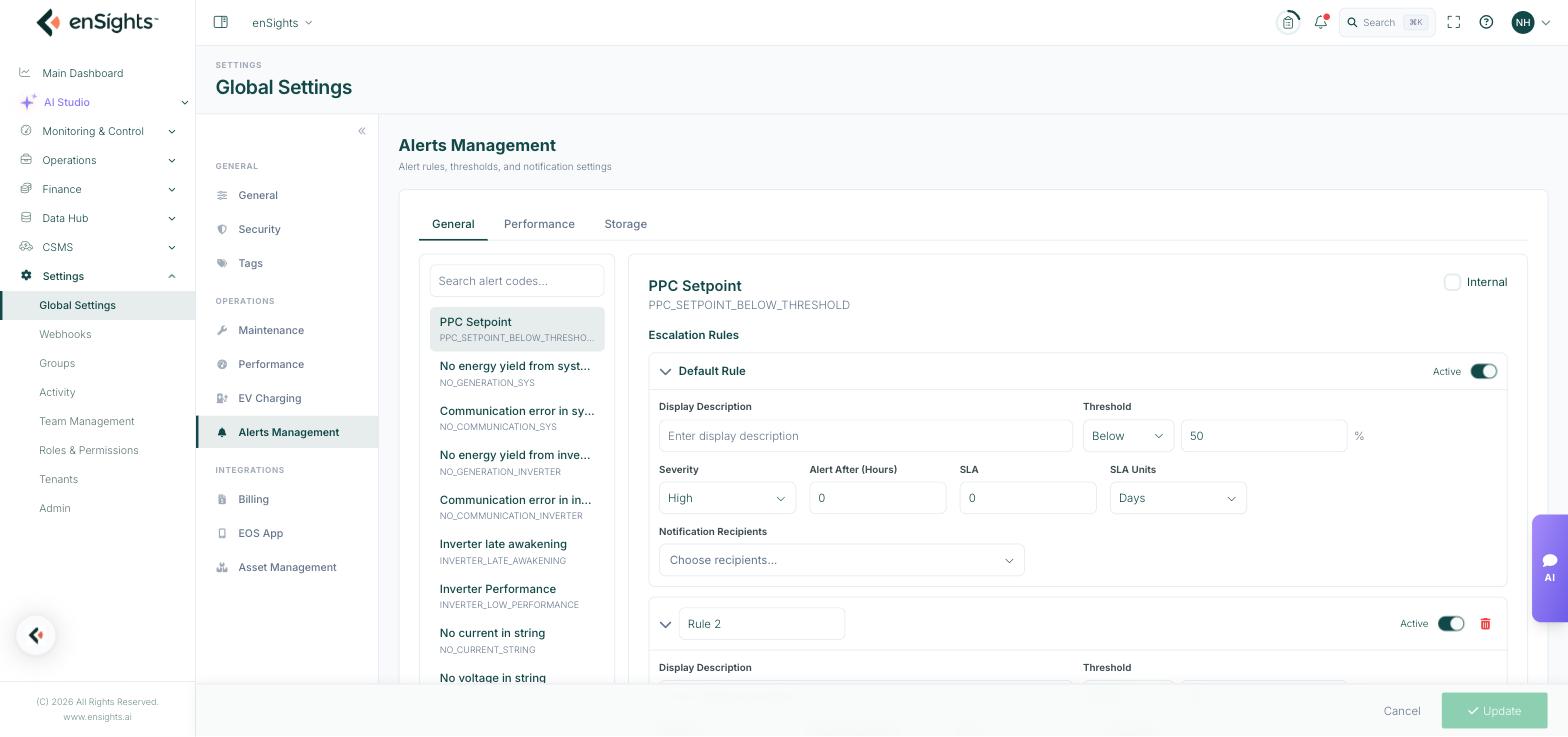
Three tabs across the top group the alert catalogue by domain:
- General — generation, communication, inverters, strings, meters, sensors, trackers, grid quality, EV chargers and invoicing. Around thirty codes.
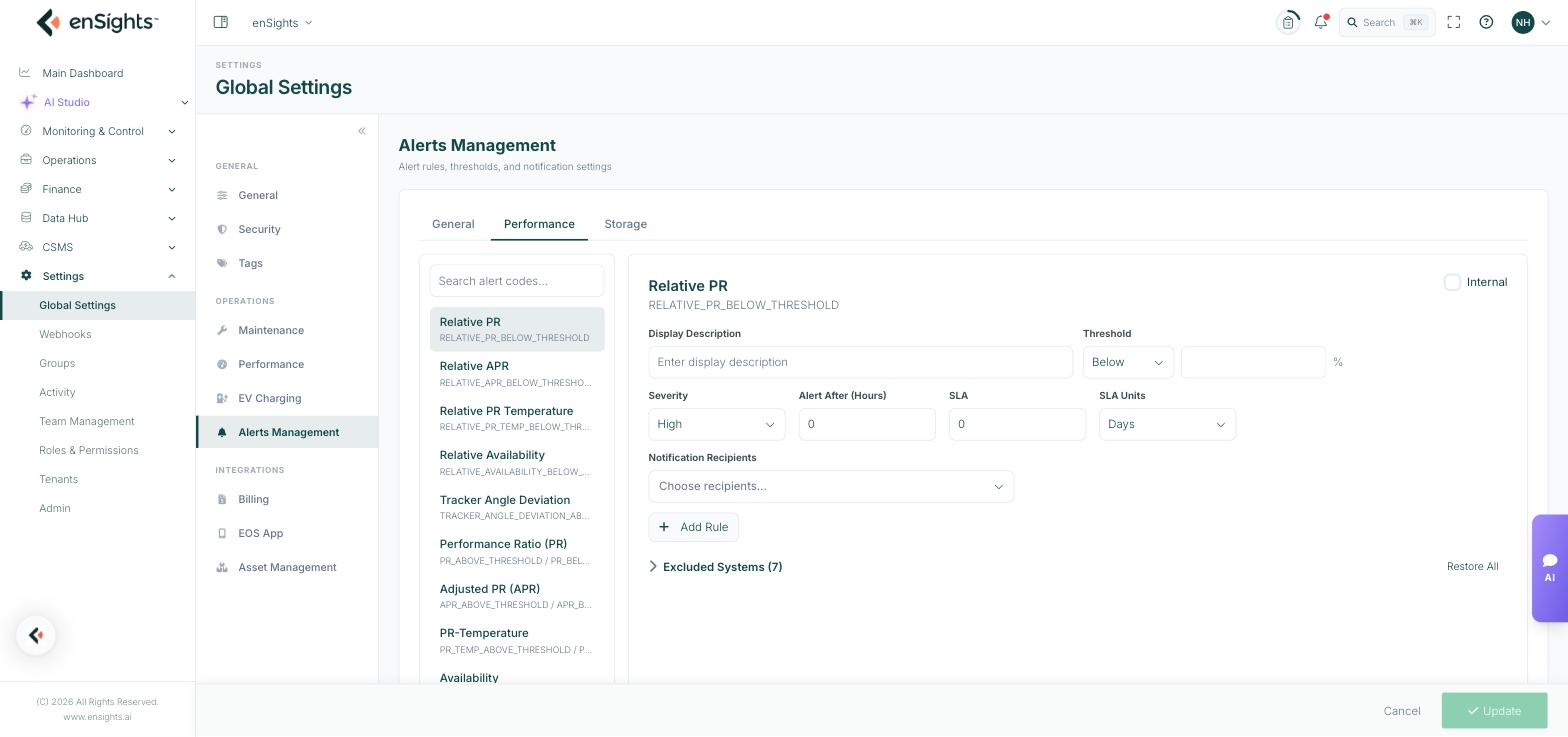
- Performance — performance ratio, adjusted PR, PR-temperature, availability, their relative equivalents, and tracker angle deviation.
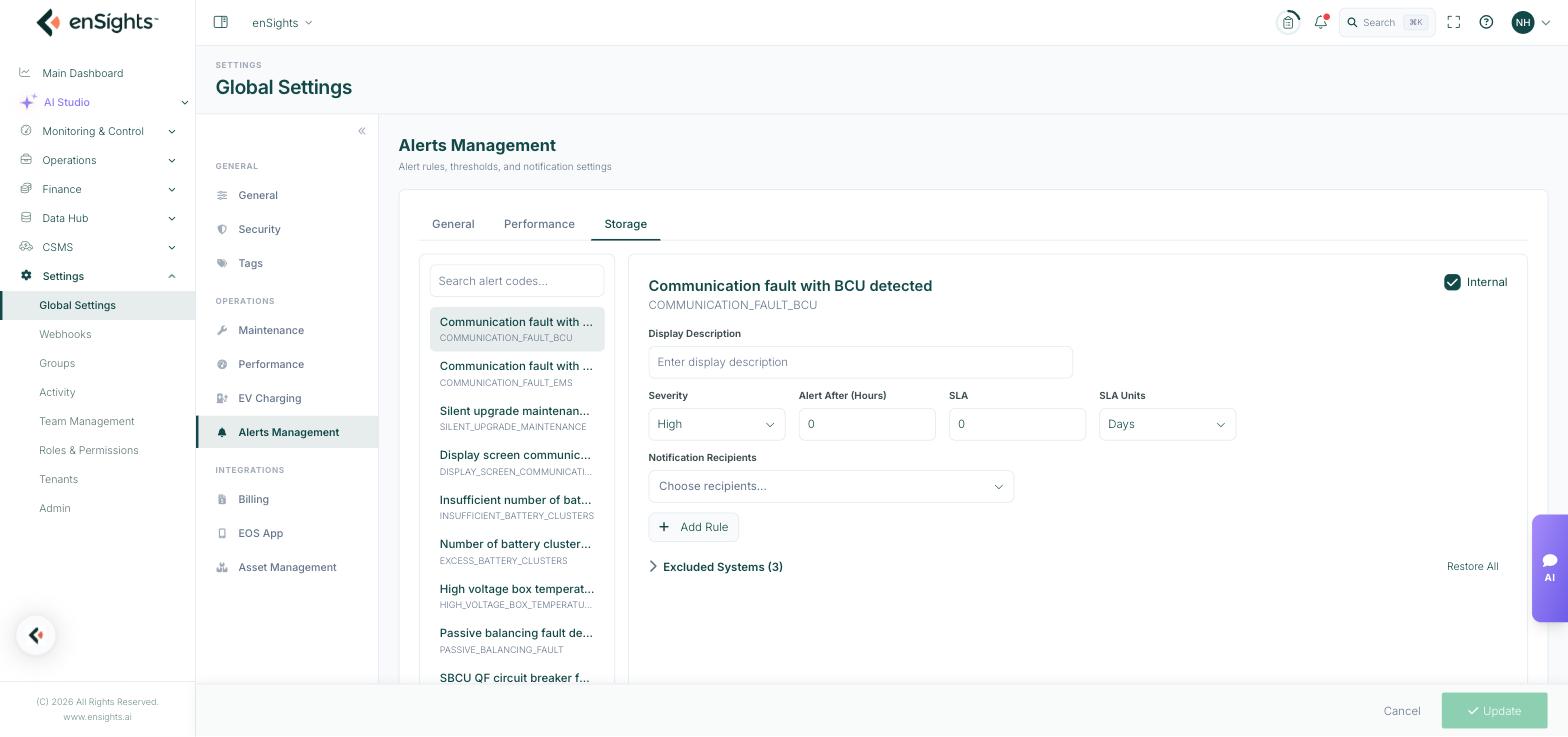
- Storage — the battery catalogue, by far the largest: BMS and PCS faults, cell voltage and temperature, insulation, fire and emergency stop, plus vendor-specific codes for Contel, Sungrow, Kstar, Jinko and Tesla.
Within each tab, the left column lists the alert codes with a Search alert codes… box above them. Selecting one opens its configuration on the right, headed by the human-readable name and the machine code underneath — for example Inverter Performance and INVERTER_LOW_PERFORMANCE. Quote that machine code when raising a support question; it is unambiguous.
Escalation Rules
Each alert has a Default Rule and can have additional rules beneath it. This is what makes escalation possible: the same condition can be minor for four hours and serious after twelve, notifying different people at each stage.
Each rule has an Active toggle, and every rule except the default can be renamed and deleted.
Field | What it does |
|---|---|
Display Description | The text shown on the alert itself. Use it to say what to do, not just what happened. |
Threshold | A comparison (Below, Above) and a percentage. The point at which the condition counts as breached. |
Severity | How serious the alert is called, for example High. Drives sorting and prioritisation in the alert lists. |
Alert After (Hours) | How long the condition must persist before the alert is raised. 0 means immediately. |
SLA and SLA Units | The response time expected once the alert is open, in hours or days. Used to flag overdue alerts. |
Notification Recipients | Who is notified. Leave empty and the alert still appears in the portal but nobody is emailed. |
There is also an Internal checkbox at the top right of the alert. Internal alerts are kept for enSights use and are not surfaced to customers.
How to add an escalation step
- Select the alert code in the left list.
- Press Add Rule.
- Name the rule, then set its threshold, severity, delay, SLA and recipients.
- Check the Active toggle is on.
- Press Update at the bottom of the page.
A common shape: the default rule fires at a mild threshold with a long delay and notifies the monitoring team; a second rule fires at a worse threshold with a shorter delay and notifies the account manager as well.
Excluded Systems
At the bottom of each alert is a collapsible Excluded Systems section with a count, listing sites for which this alert has been suppressed. Each row has a Restore link, and Restore All clears the list.
Exclusions are how a known, accepted condition at one site stops generating alerts without weakening the rule for everyone else — a site awaiting a part, or one whose sensor is known bad. Review the list periodically: an exclusion added during an incident and never removed is a fault you have permanently agreed not to see.
How to tune a noisy alert
- Find the code in the left list — search by name or by machine code.
- Look at Alert After (Hours) first. Raising it filters transient conditions without hiding real ones, and is usually a better first move than moving the threshold.
- If the alert is genuinely mis-scoped, adjust the Threshold.
- If only a handful of sites are responsible, exclude those sites rather than changing the rule.
- Press Update, then watch the next day or two before changing anything else.
Notes
- Changes are account-wide and apply from the next evaluation. Alerts already open are not re-evaluated.
- Turning a rule inactive is reversible and leaves the configuration intact — prefer it to deleting a rule you may want back.
- An alert with no recipients still appears in the portal. Silence is not the same as absence.
- Change one rule at a time. Loosening several thresholds at once makes it impossible to tell which change caused the flood.
- Vendor-specific storage codes only fire on hardware from that vendor — the Contel, Sungrow, Kstar, Jinko and Tesla families are irrelevant if you run none of them.