
Reports: building and scheduling a report
Monitoring & Control → Reports → + → choose a template
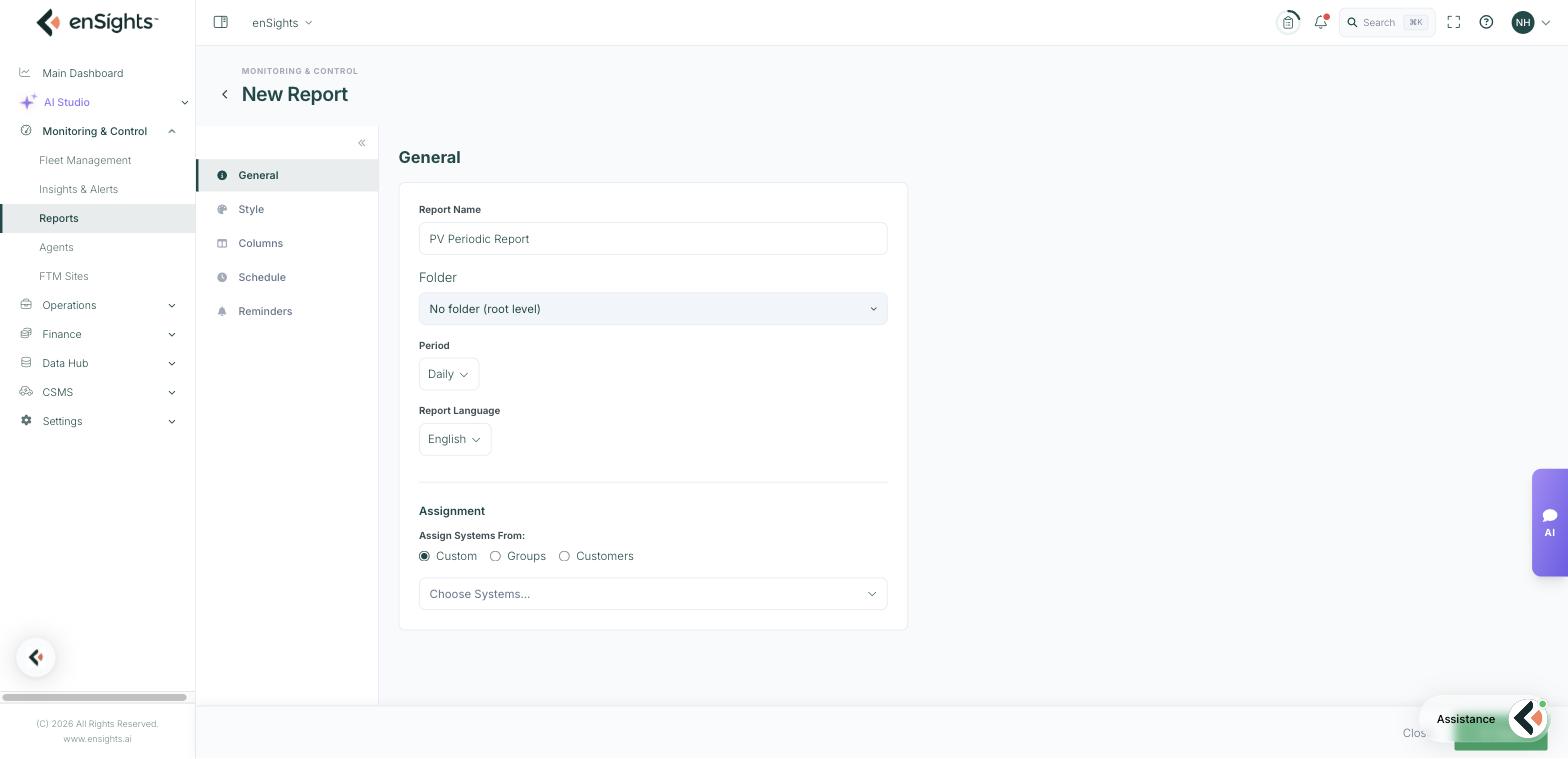
The editor has five tabs down the left — General, Style, Columns, Schedule and Reminders — with Save and Close in the footer. Working through them in order takes a couple of minutes and the report then runs by itself.
General — what the report covers
- Report Name — what recipients will see. Include the audience or portfolio; "Monthly – Northside PPA" beats "Report 4".
- Folder — where it lives in the library, or root level.
- Period — the reporting period. The template tells you which ones it supports (for example Daily, Weekly, Monthly, Yearly).
- Report Language — the output language, independent of your own interface language. Set it per audience.
- Assignment — Assign Systems From: Custom (pick systems by hand), Groups (a system group) or Customers (everything belonging to a customer).
Prefer Groups or Customers over Custom wherever you can: the report then follows the portfolio automatically as sites are added or sold, instead of quietly going out of date.
Style — how it looks
- Header Background, Footer Background, Header Alignment, Logo Width — the branding.
- Cover page — None, Custom or PDF (supply your own cover).
- System Address in Header — include the site's address.
- Hide Alerts Icons — remove the operational alert markers from a document meant for owners.
- Show Expected — include the expected figures next to actuals so variance is visible.
- Hide Revenue — leave money out of a purely technical report.
- Hide Normalized — drop the normalised columns for a less technical audience.
- Environment Contribution — add the CO₂ and trees-equivalent section that owners and marketing teams like.
- Additional Components — extra sections the template supports.
- AI Executive Summary — prepend a written summary of the period generated from the report's own data. Useful for busy recipients; read it before the first send so you are comfortable with the tone.
Columns — what it carries
The same metric catalogue as the fleet table: production, revenue, meter figures, PR variants, availability, irradiation, weather-adjusted energy, data-quality checks and more, plus Completeness, which tells the reader how much of the period actually had data — the column that stops an incomplete month being read as a bad month.
Keep the set short. A report with fifteen columns is usually one nobody reads; three or four well-chosen ones travel much further.
Schedule — when it goes out
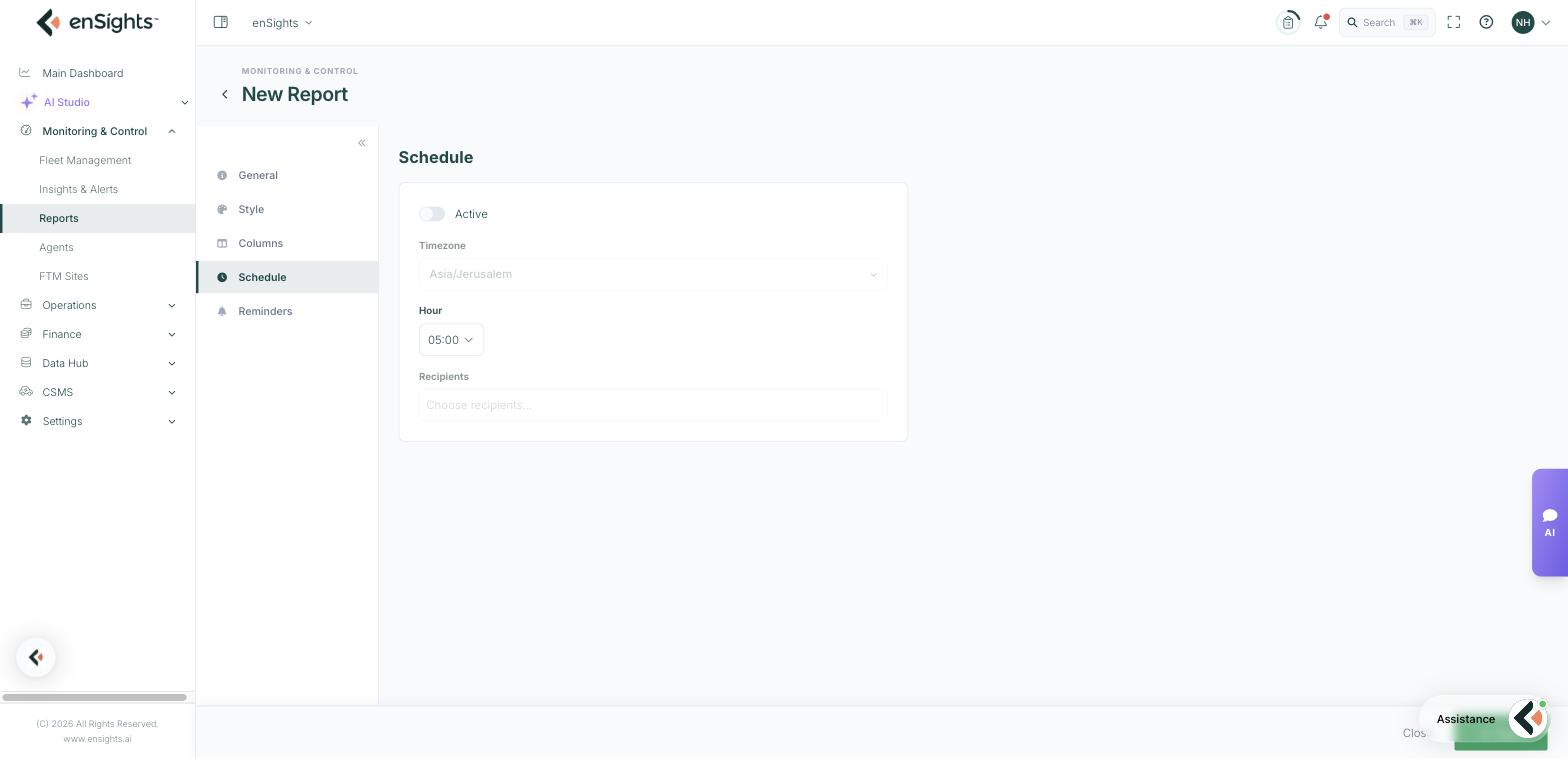
- Active — the switch that makes it automatic.
- Timezone and Hour — when it is generated and sent. Pick an hour after the previous period's data has landed; early-morning sends can catch an incomplete final day.
- Recipients — who receives it.
Reminders
A reminder attached to the report itself, with its own recipients and schedule — for the human tasks around it, such as reviewing a draft invoice report before the billing run.
Common tasks
Owner report in five minutes. Template: PV Periodic → General: name, Monthly, Assignment by Customer → Style: Show Expected on, Environment Contribution on → Columns: production, expected, actual vs expected, PR → Schedule: Active, 08:00 local, recipients → Save.
Internal triage report. Template: Least Performed Systems → weekly → columns focused on PR and availability → recipients: the operations list.
Report an owner can read. Hide Normalized, Hide Alerts Icons, keep four columns, and turn on the AI Executive Summary.
Check before it goes live. Save with Schedule inactive, generate once, read it, then activate.
Common questions
Recipients did not get it.
Check Active on the Schedule tab and the recipient list, then Reports Archive to see whether it generated at all.
The report shows fewer systems than expected.
Assignment is probably Custom and the newer sites were never added. Switch to Groups or Customers.
Numbers differ from the portal.
Compare periods and timezone first — a report generated at 05:00 for "yesterday" can include a partial final interval. The Completeness column makes this visible.