
Expected Weather Adjusted Power
What Expected Weather Adjusted Power tells you
A solar site's output depends almost entirely on how much sun it received. "500 kWh yesterday" means nothing on its own — was the day clear or overcast? Weather adjustment answers a more useful question: given the sunlight this site actually received, how much should it have produced?
Expected Weather Adjusted (WA) Power is an expectation computed from measured irradiance — not a measurement. That is why it is always drawn as a dashed line, while actual output is drawn solid.
Comparing actual output against the expected curve separates two things that raw kWh cannot: a low day caused by weather (both lines drop together — nothing wrong) from a low day caused by a problem at the site (the expected line stays high while actual collapses).
Where the inputs come from
Expected WA Power is driven by one input, entered once per site:
- Open the site's Performance tab.
- Enter twelve monthly pairs: Expected Production (kWh) and Expected Irradiance (kWh/m²).
That is all the Simple method requires. The same twelve pairs produce both the expected energy and the expected power curve.
Two methods: Advanced and Simple
Choose the method per system in Edit → Advanced → Advanced weather adjusted calculation.
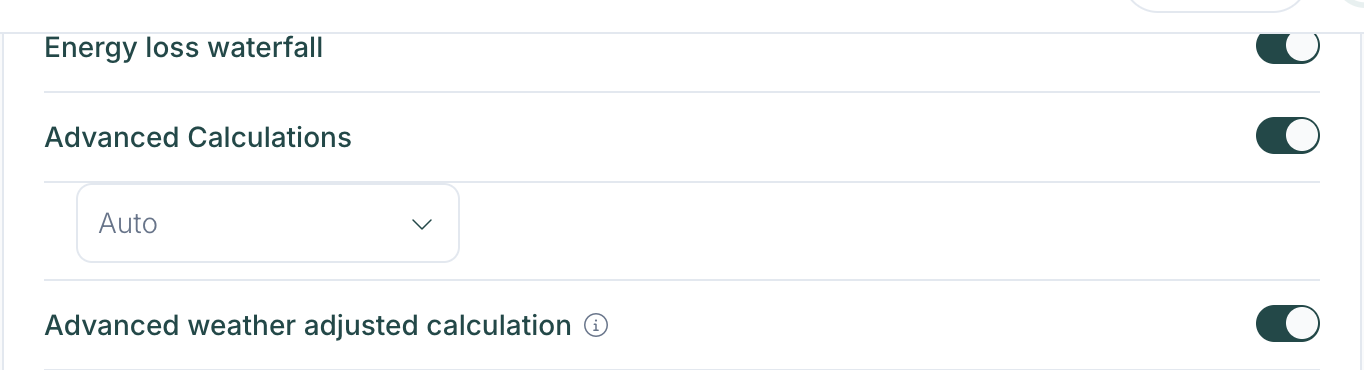
Toggle | Method | What it needs |
|---|---|---|
On (default) | Advanced: the PVsyst-based model. | Irradiance for the site, plus temperature. Uses the system's performance parameters and falls back to defaults for any left empty. |
Off | Simple: scales expected production by the irradiance the site actually received, as described below. | Irradiance for the site, plus all twelve monthly pairs on the Performance tab. |
Both methods need irradiance for the site, from an on-site sensor or the weather service. If any of the twelve expected-irradiance months is missing, the site stays on the Advanced method even with the toggle off. The calculation below is the Simple method.
How it is calculated
Step 1 — the monthly coefficient
Dividing the two monthly inputs gives k, which is physically an effective collecting area in m² — roughly panel area × system efficiency.
k_month = Expected Production (kWh) / Expected Irradiance (kWh/m²)
Example (January): 95,000 kWh / 120 kWh/m² = 791.7 m²
Allowing for system age
Panels lose a little output every year. Expected Production already allows for this, so the coefficient does too: the monthly Expected Production is aged by the system's degradation rate before it is divided by Expected Irradiance. Without that, an aged Expected Production would sit next to a weather-adjusted figure for a brand-new system, and the two numbers would not reconcile.
Step | Calculation |
|---|---|
Age factor | (1 − annual degradation rate) ^ years since the system was installed |
Coefficient | k_month = (Expected Production × age factor) ÷ Expected Irradiance |
Weather Adj. Energy | POA irradiation for the period × k_month |
The degradation rate and install date come from the system's settings. With a degradation rate of 0.568% a year, the age factor is 0.994 after one year, 0.989 after two and 0.972 after five.
Worked example. A one-year-old system expects 13,063 kWh in September from 136.7 kWh/m² and measures 152.09 kWh/m² of POA irradiation. Without the age factor, k = 95.56 and Weather Adj. Energy = 14.53 MWh. With it, k = 95.02 and Weather Adj. Energy = 14.45 MWh, which is 0.57% lower.
- The age factor only ever lowers the expectation, and older systems move more.
- It applies to the Simple method. Systems on the Advanced method are not affected.
- Weather-adjusted values for Simple-method systems are slightly lower than before this change, for the same periods.
Step 2 — the same coefficient gives energy and power
Expected WA Energy (kWh) = Irradiance over the period (kWh/m²) × k_month
Expected WA Power (kW) = ( Irradiance now (W/m²) / 1000 ) × k_month
Energy is a total over a period. Power is a rate at an instant — so Expected WA Power is a curve across the day: the arc the site should have traced.
1 · A healthy day
Actual output tracks the expected curve closely all day. This is what "nothing wrong here" looks like — and note that it says nothing about whether it was a good day, only whether the site did what the weather allowed.
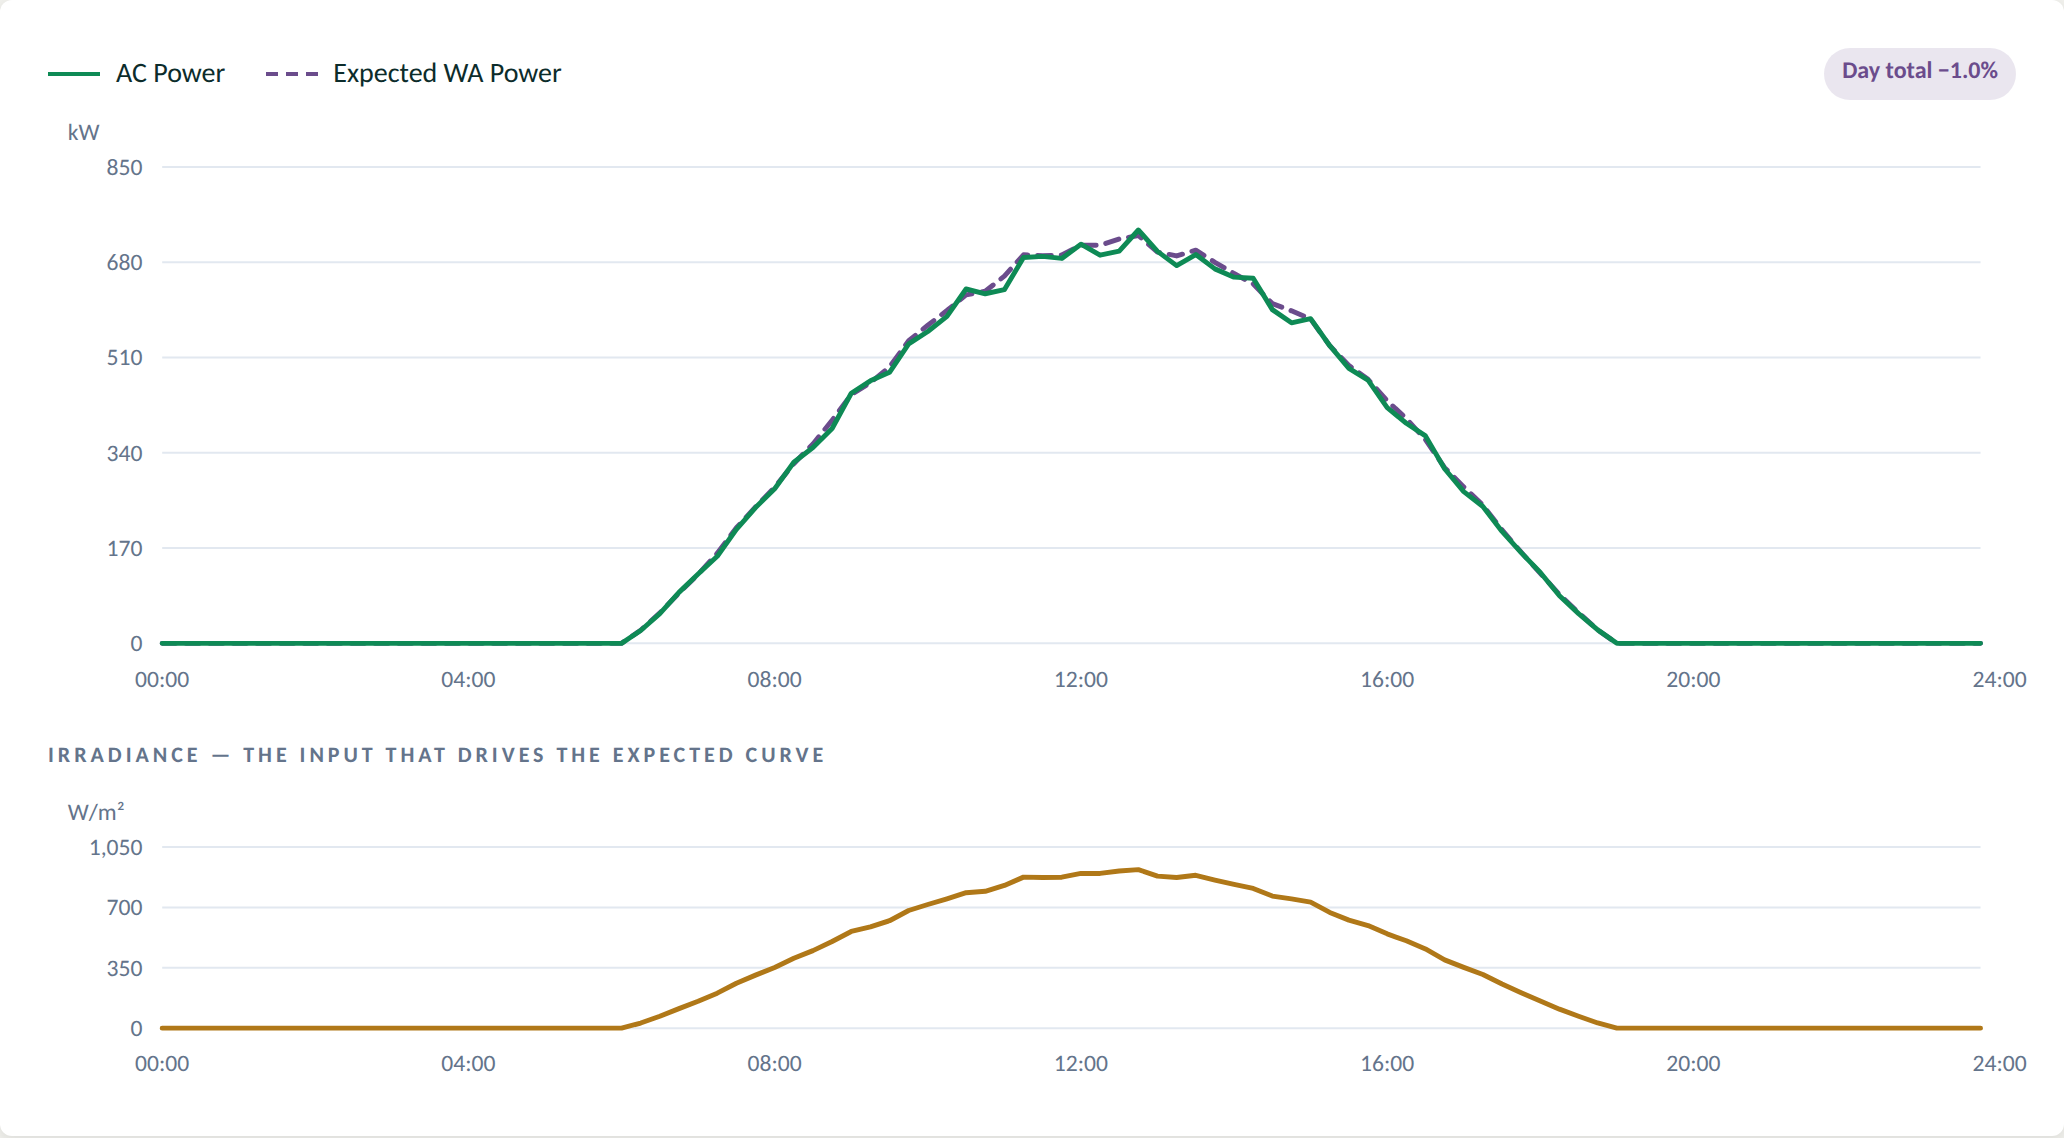
Irradiance sits in its own panel on a shared time axis rather than on a second y-axis. Two different units on one axis makes the relationship look like whatever the scaling chose.
Reading the 13:00 point off that chart:
- Irradiance was 905 W/m²
- Expected WA Power = 905 / 1000 × 791.7 = 716.4 kW
- Measured AC power = 709.1 kW
- Deviation = −1% — actual is tracking the expected curve
2 · An underperforming day
Same site, same formula. On a cloudy day both lines drop together and nothing is flagged; here the expected line stays high while actual output collapses. That gap is the whole point of the metric.
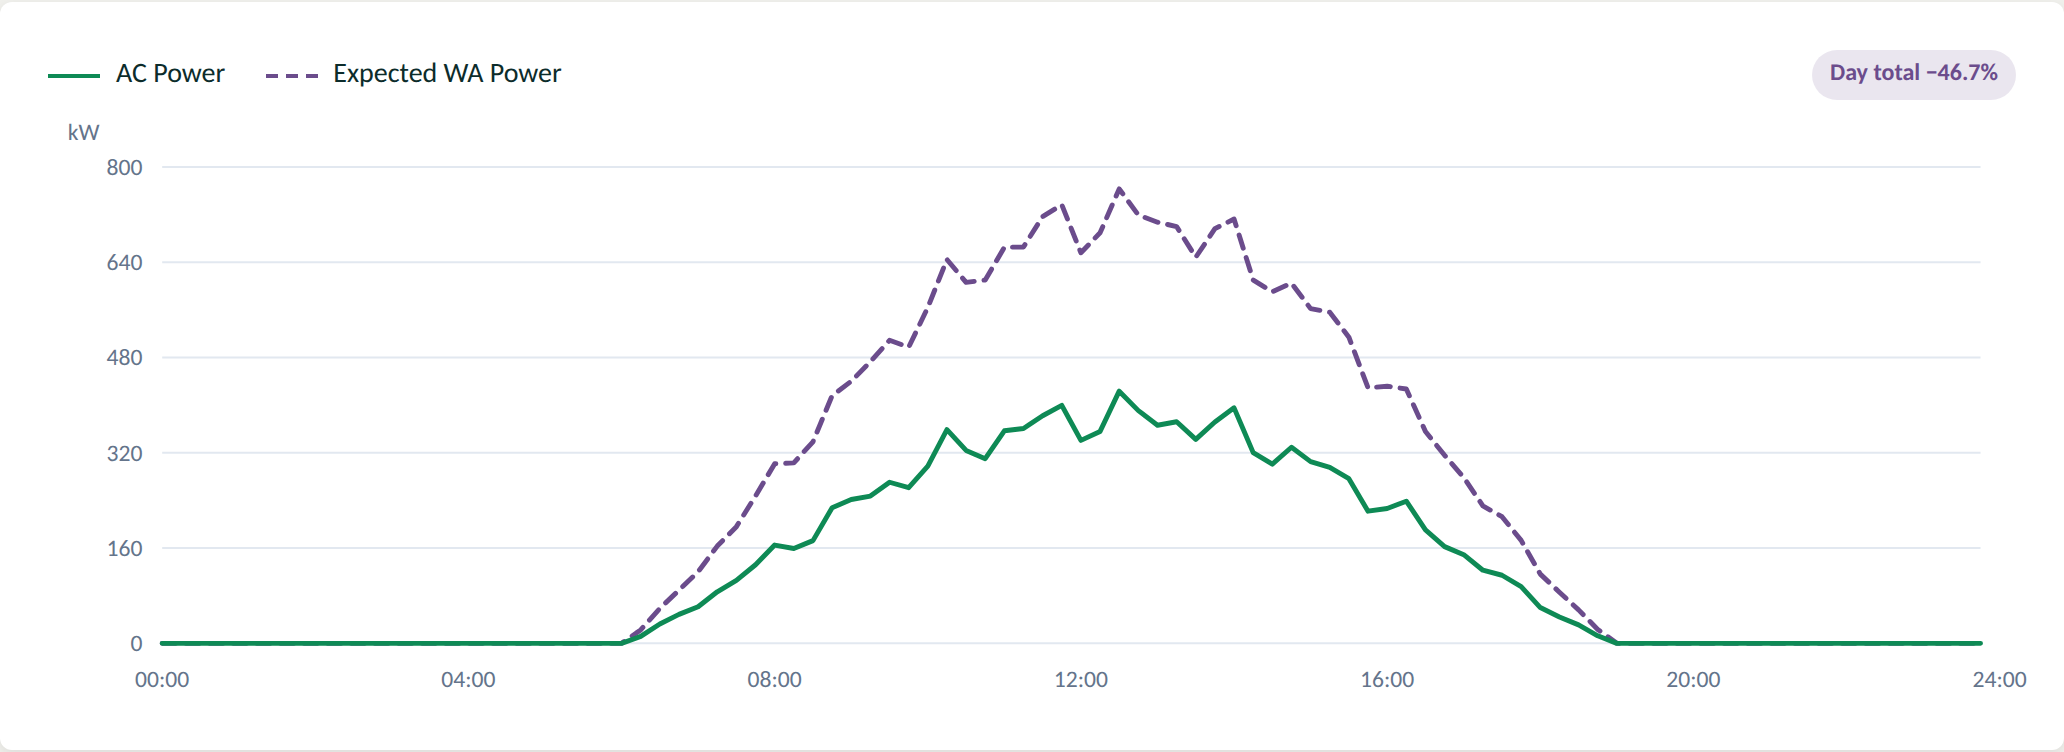
Actual output well below the expected curve all day — a site problem, not a weather day.
The headline number in the PV Systems table and in reports is the ratio of the two day totals:
Actual vs. Expected WA = (( Actual Energy / Expected WA Energy ) − 1) × 100
(( 226.89 kWh / 425.43 kWh ) − 1) × 100 = −46.7%
Sensor-based Performance Ratio on that day was 41.5%, against 80.3% on the healthy day — the two metrics agree that this is a site problem.
3 · A clipping day
On some days the panels can produce more than the inverter's AC limit. Output pins flat against that ceiling around midday. Energy is genuinely lost, but the inverter is perfectly healthy — and judged on raw kWh alone it can look like the worst performer on the site.
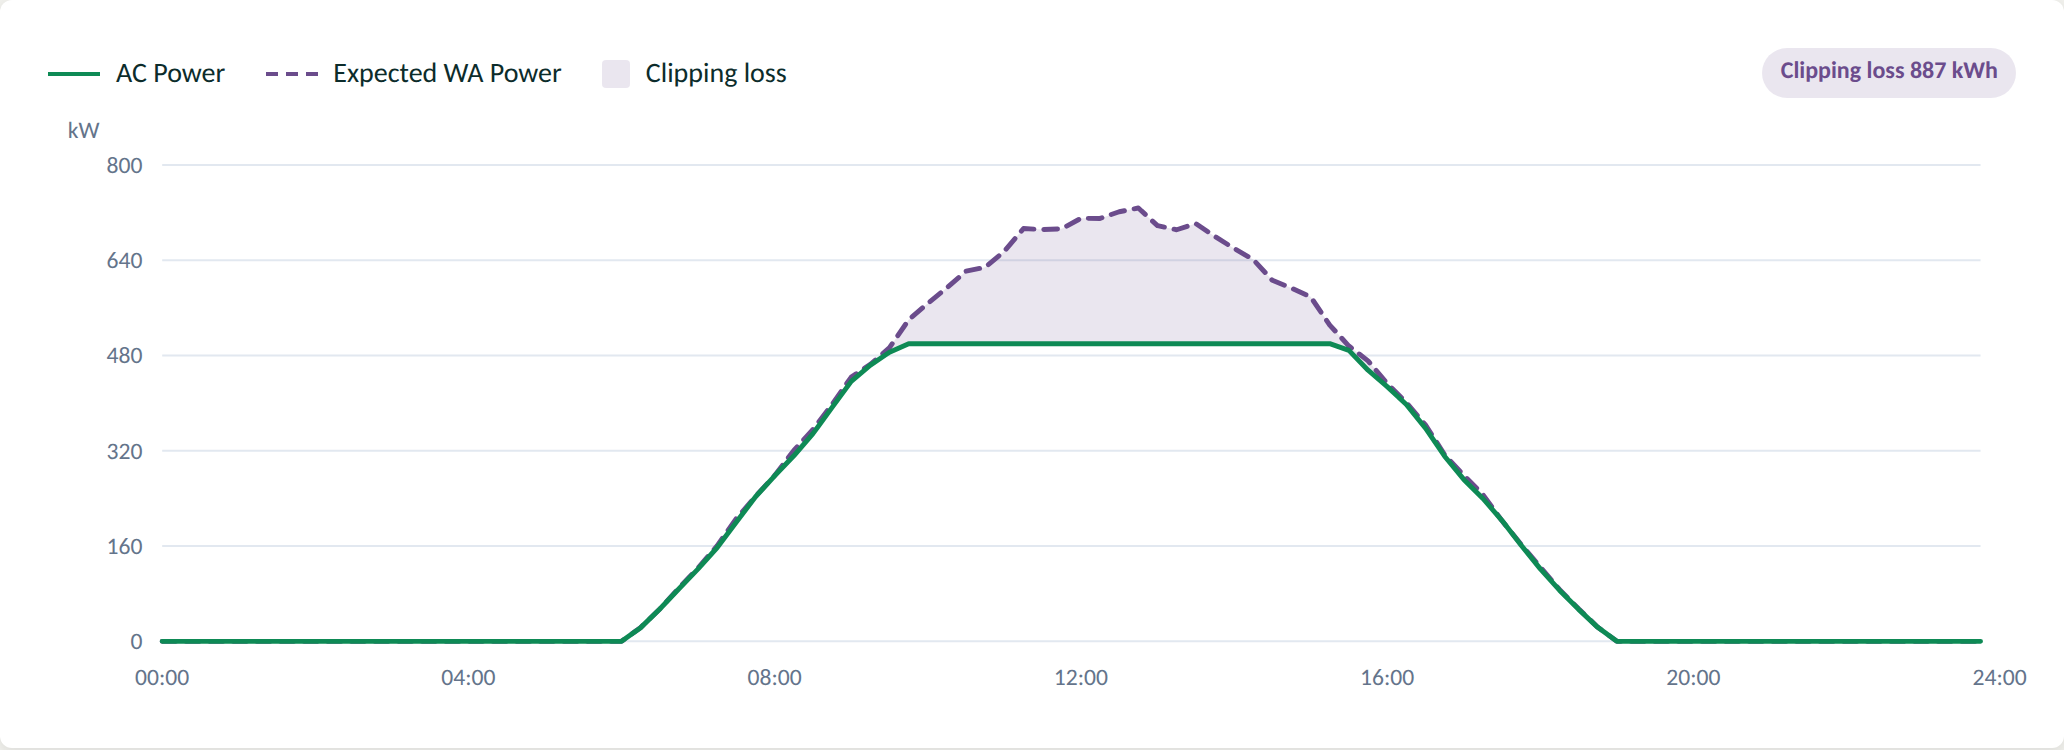
The shaded area is clipping loss — the energy the array could have made above the inverter's AC ceiling.
Clipping Loss = Σ over clipped intervals of max(0, Expected − Measured) × Δt
Potential Energy = Measured Energy + Clipping Loss
Normalized = Potential Energy / DC Capacity
Why clipping cannot be read off daily totals. The max(0, …) sits inside the sum. Subtracting daily actual from daily expected nets the intervals where actual ran above expected against the ones where it fell short — and clipping only ever runs in one direction. Clipping is a shape; sum the day and it disappears. It is only visible in the 15-minute series.4 · Across many days
In the trend view, each day becomes one column instead of 96 points. Because kW cannot be summed, "daily power" needs a definition:
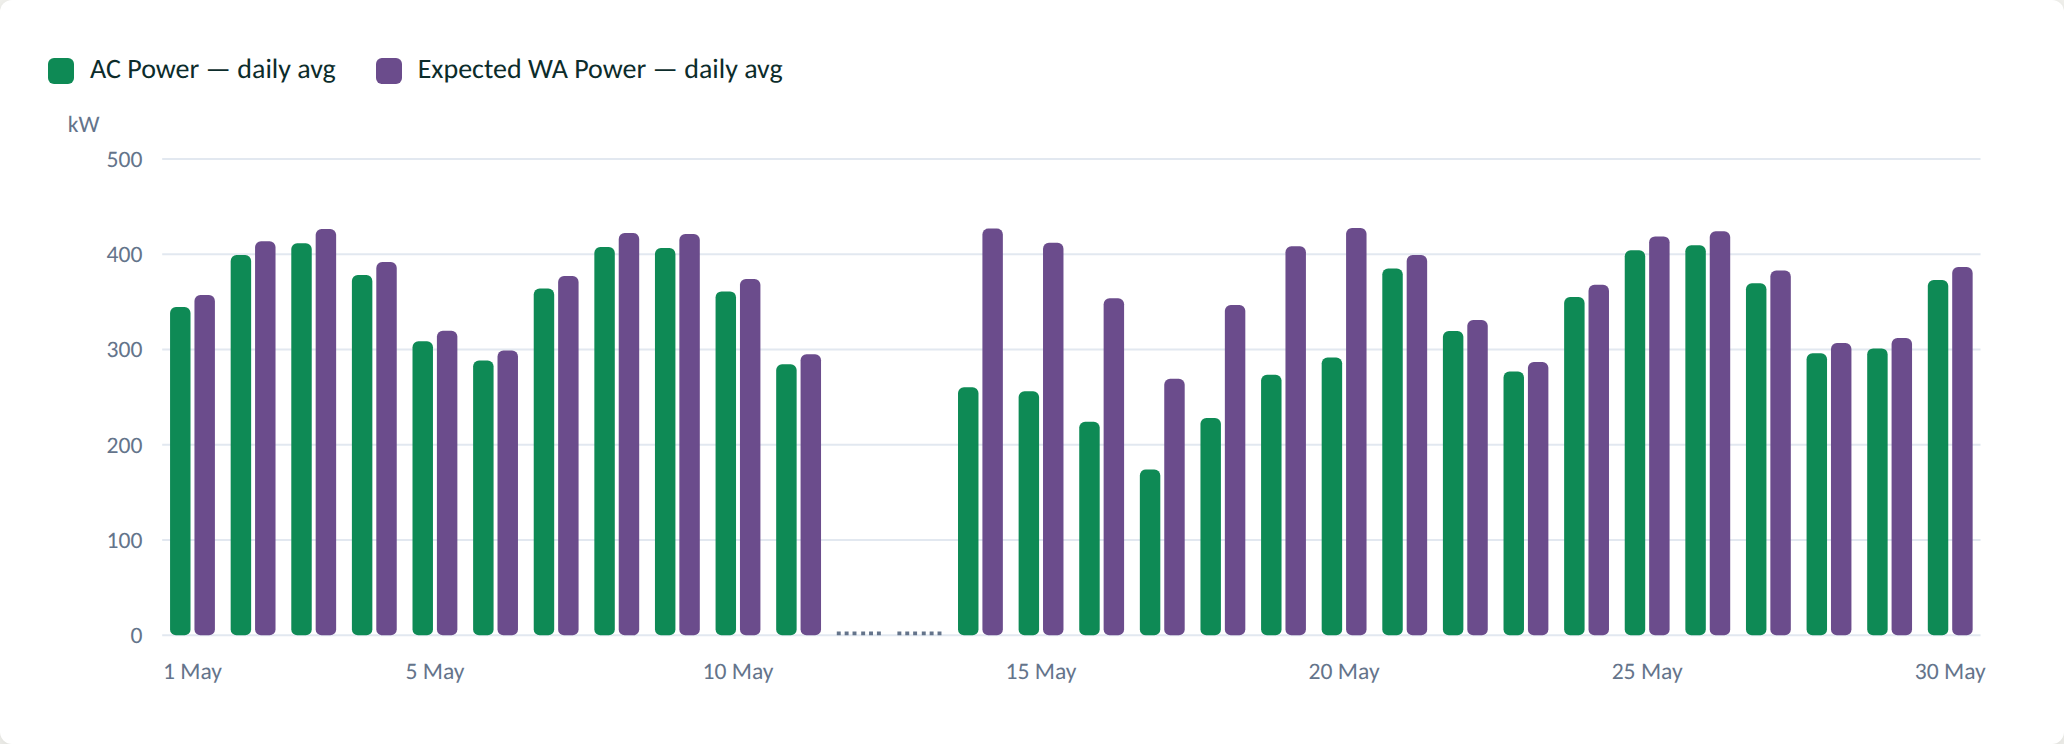
Daily averages for both series, taken over the same daylight window.
Daily average = Expected WA Energy for the day / daylight hoursBoth series are averaged over the same daylight window, never over 24 hours. Averaging over 24 hours preserves the ratio but shrinks the axis to something meaningless — a clear day on this site reads roughly 430 kW over daylight and 230 kW over 24 hours, purely because the night went into the divisor. The gap between the two columns reads as the energy shortfall for that day.
5 · The inverter low-performance alert
Everything above is site level. The alert works one level down. The site's expected curve is shared out among inverters in proportion to DC size — a scalar multiply:
Expected WA Power(inverter i) = Expected WA Power(system) × ( DC Capacity of i / Σ DC Capacity )Why that matters is easiest to see on a real site: 16 inverters, every one rated 125 kW AC, but with different numbers of strings behind them — six have 11 strings, nine have 10, and one has 9.
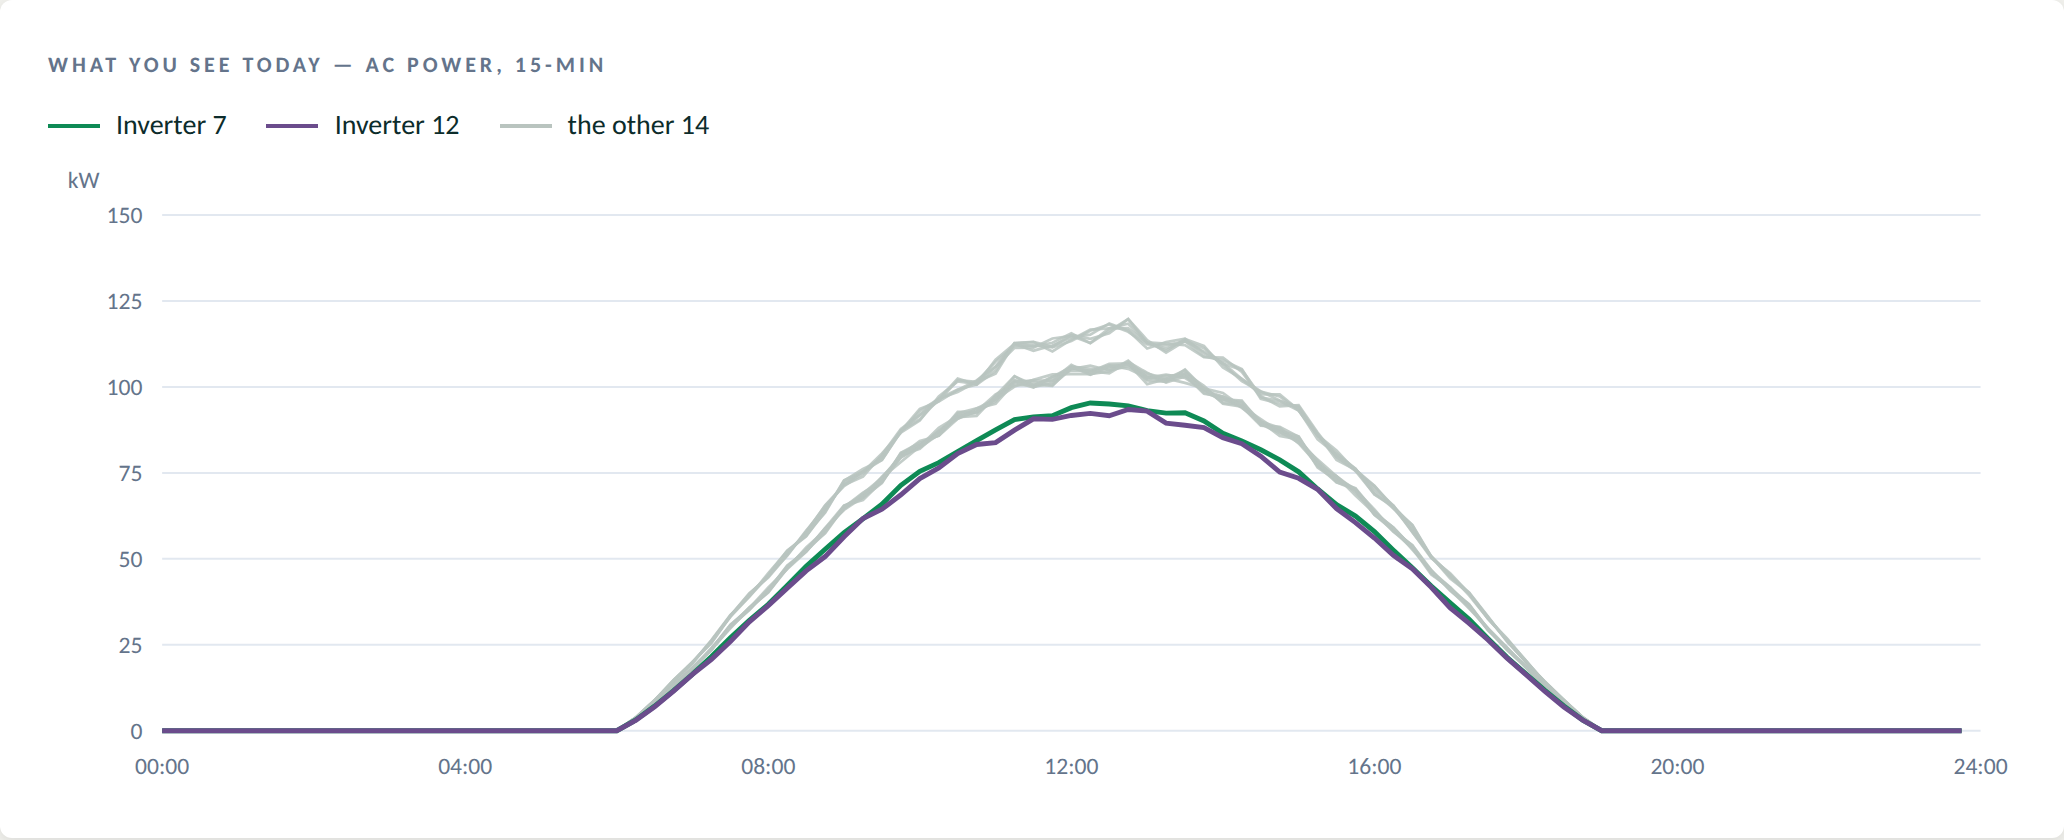
Two inverters run below the pack all day and look like the same problem. They are not — one simply has less DC behind it, the other is broken. Raw AC power cannot tell you which is which.
The three normalization tiers
Tier | Normalization | Requires | If not met |
|---|---|---|---|
Tier 1 — Advanced | Expected WA Power ÷ DC capacity | Irradiance + weather-adjustment method + DC capacity on all inverters | Falls to Tier 3 |
Tier 2 — Simple | Measured AC power ÷ DC capacity | DC capacity on all inverters | Falls to Tier 3 |
Tier 3 — Baseline | Measured AC power ÷ AC capacity | Nothing | — |
The tier is decided per site by data availability, and the gate is all-or-nothing: every inverter needs DC capacity, or the whole site drops to Tier 3. A site never compares one inverter on a DC basis and its neighbour on an AC basis, and Tier 1 has no AC-capacity fallback for the same reason. One site, one basis — shown on screen, so any alert can be explained.
How detection works
- Normalize every inverter on the site by its tier's basis.
- Peer reference = fleet mean of the normalized values.
Deviation(i) = ( Normalized(i) / Peer reference − 1 ) × 100- Flag when
Deviation(i)falls below the configured threshold (−10% in the examples below).
The mechanic is identical at every tier — only the denominator in step 1 changes, which is why the active tier is shown to you.
Tier 3 — normalized by AC capacity
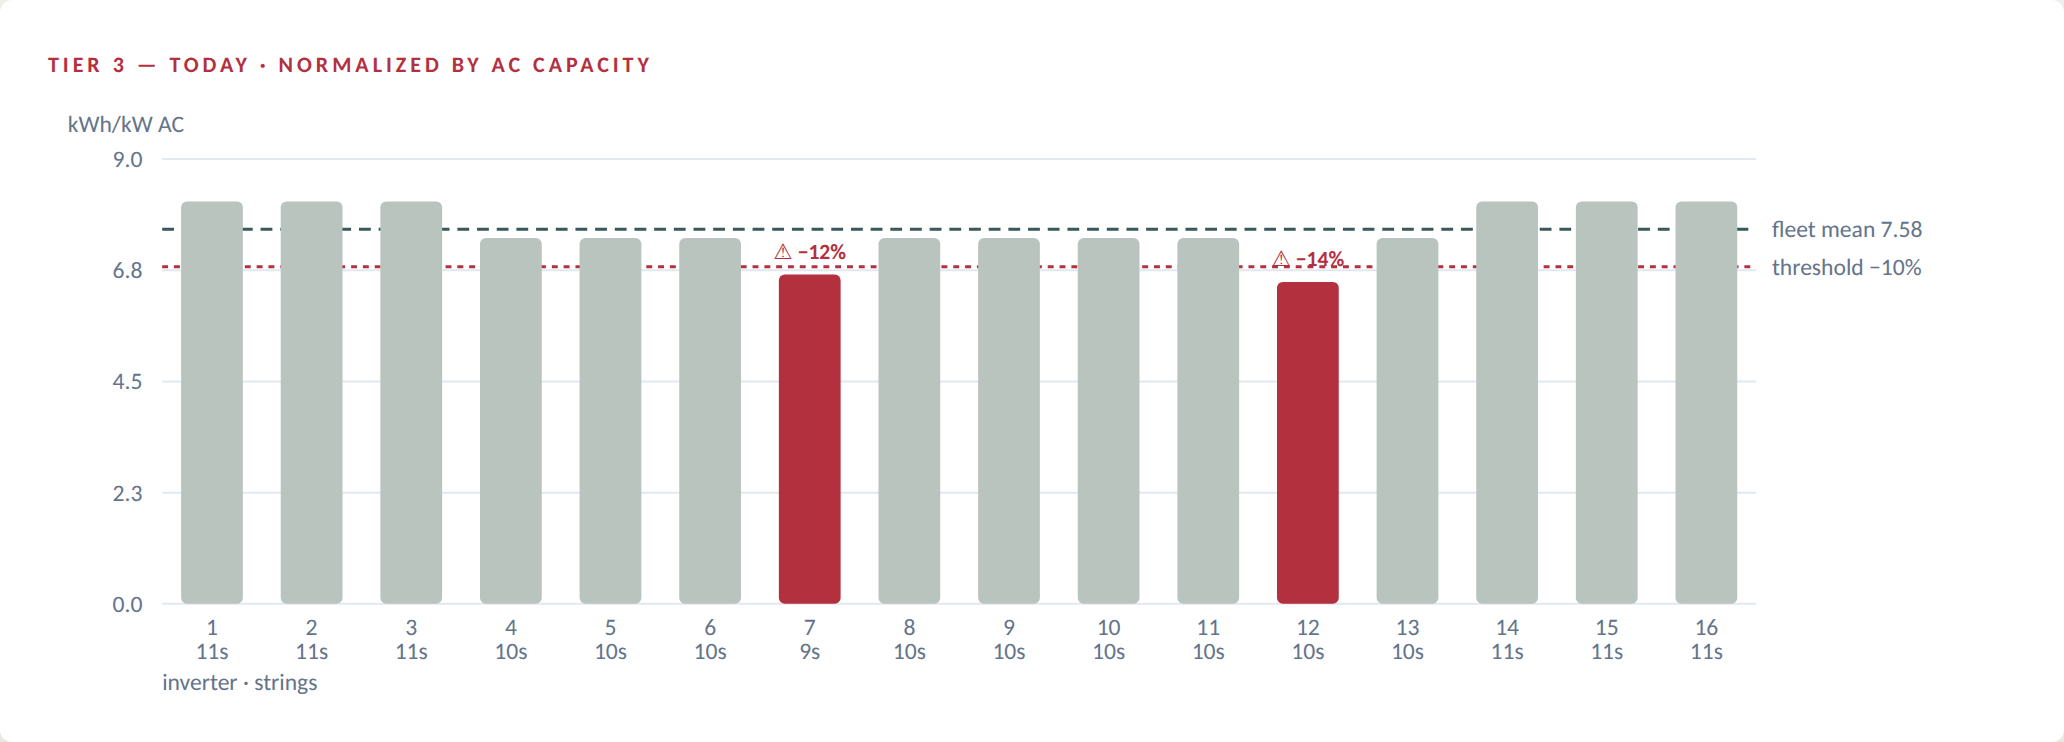
Two flags, one of them wrong.
Inverter 7 is healthy — it has 9 strings where its neighbours have 10 or 11, so 10% less DC behind the same 125 kW AC rating. Dividing by AC capacity turns that structural difference into an apparent fault, and the same false alert arrives every day for the life of the site.
Tier 2 or Tier 1 — normalized by DC capacity
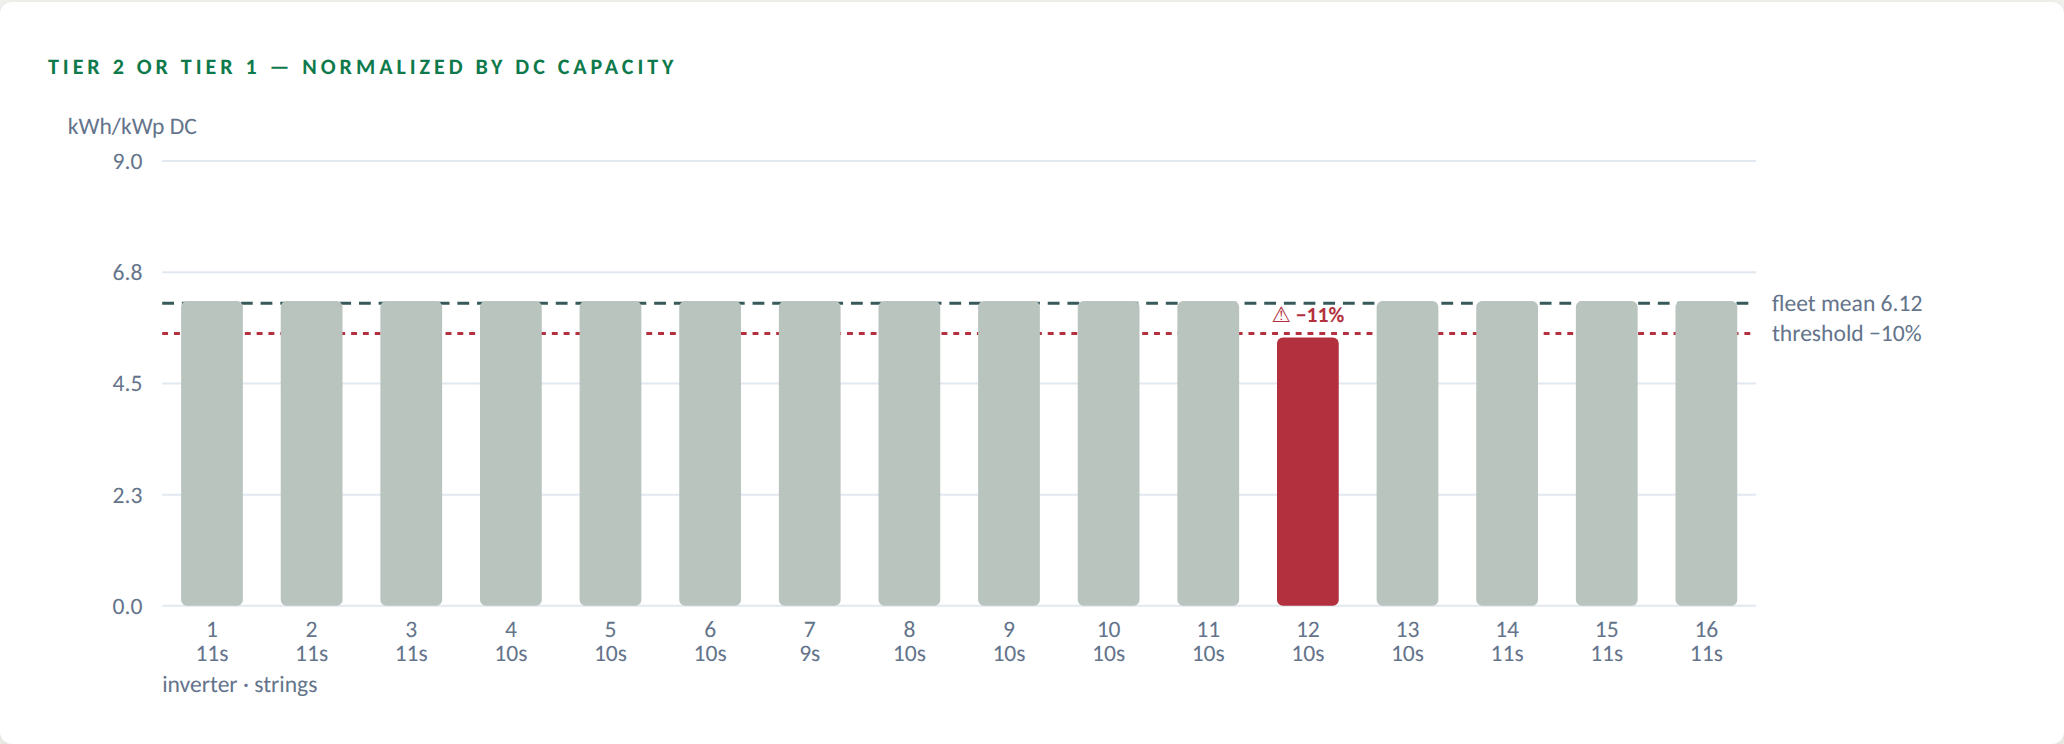
One flag, and it is the real one.
Output and DC capacity scale together, so dividing one by the other cancels the string-count difference out. Every healthy inverter lands on the same value regardless of string count; inverter 7 drops out of the alert and inverter 12 stays flagged, because its problem is real.
Tier 1 adds weather adjustment on top of the same DC basis: instead of comparing each inverter only to its neighbours, it compares each inverter to what the weather said it should have produced — its own share of the site's expected curve. That is what catches the case where the whole site sags together and peer comparison sees nothing wrong.
Deviation(i) = ( Potential Energy(i) / DC Capacity(i) ) ÷ peer reference − 1Potential Energy is measured energy with clipping added back (see section 3). That recovery is what stops a clipping inverter from being flagged at Tier 1.
For the full detail of the alert, including how to configure it, see Inverter low-performance detection.
Where you see it
- PV Systems table: Weather Adj. Energy and Actual vs. Expected columns, plus Expected Irradiance, prorated by days from the twelve monthly values. Expected Irradiance shows N/A when any month the period covers isn't configured.
- Analysis tab: the Weather Adjusted KPI, and Weather Adj. Energy / Weather Adj. Power as graph measurements.
- Reports: Periodic and Aggregated reports, at every granularity.
How to
Get weather-adjusted numbers on a system without a PVsyst model
- Open the system and go to Edit → Performance.
- Fill in Expected Production and Expected Irradiance for all twelve months.
- Go to Advanced and switch Advanced weather adjusted calculation off.
- Save. Weather-adjusted values fill in for periods where the site also has measured irradiance. Past periods are recalculated in the background.
Explain a bad month to an owner
- Open the system's Analysis tab for the month.
- Compare Production with Weather Adjusted. If they are close, the month was simply cloudy and the site did what the weather allowed.
- If production is well below the weather-adjusted figure, the shortfall is the site's, not the weather's. Check the Insights tab for the alerts behind it.
Chart conventions
- Dashed vs solid. On intraday line charts, expected is always dashed and actual is always solid. On aggregated column charts the pair is distinguished by colour instead.
- One y-axis for power. Both power series share a single y-axis because they share a unit. Irradiance appears in its own panel on the same time axis, never on a second y-axis.
- Daily averages use daylight hours, the same window for both series.
- Missing is not zero. A day with no irradiance gets no column, and tables show
—rather than 0. A zero-height column would read as "we expected nothing", which is wrong; the truth is "we don't know". A short dashed stub on the baseline marks the gap.
Common questions
The expected line looks far too high — what went wrong?
Almost always the monthly inputs in the Performance tab. Check that Expected Production is in kWh and Expected Irradiance is in kWh/m² for the same month, and that all twelve months are filled in.
Why is my site on Tier 3 when it has irradiance data?
Tier 1 and Tier 2 both require DC capacity on every inverter at the site. A single inverter missing DC capacity drops the whole site to Tier 3. Filling in the missing value is what moves the site back up.
Both lines dropped together yesterday. Should I investigate?
No — that is a weather day. The expected curve dropped because the irradiance did. Investigate when the gap between the lines opens, not when both fall.
One inverter shows a big clipping loss. Is it faulty?
No. Clipping means the array can produce more than the inverter's AC limit. The energy is real and lost, but the inverter is working as designed — which is why Tier 1 adds clipping back before comparing inverters.
I switched Advanced weather adjusted calculation off, but the site still uses the advanced method.
The Simple method needs all twelve months of Expected Irradiance on the Performance tab. With any month missing, the site stays on the advanced calculation.
A weather-adjusted cell shows a dash.
Irradiance is missing for the period, the monthly inputs aren't set up, or expected irradiance is zero. A dash means "we don't know", not zero.