
Finance: Storage Calculator US
What this page is for
The Storage Calculator answers a pre-investment question: if we put a battery at this industrial site, what is it worth? You give it a location, a few site details and the customer's electricity bills; it models the revenue stack available under that state's tariff and returns first-year savings, payback, IRR and NPV, packaged as a shareable feasibility report.
It is the one page in Finance that has nothing to do with your existing assets. Nothing here reads from or writes to your live contracts, invoices or P&L — it models a project that does not exist yet.
The subtitle on the page states the scope plainly: build a battery Value Stack feasibility report for North American energy markets.
The five steps
A stepper across the top shows where you are and lets you move back:
Step | What it collects |
|---|---|
01 Location | The state, which determines the utility, tariff and regulatory rules the model uses. |
02 Project info | Project identity, contact details and the site address. |
03 Bill data | The customer's electricity bills — the input the whole model rests on. |
04 Battery design | Battery size and configuration. |
05 Value Stack | The finished report: the revenue streams and the financial result. |
Step 1 — Location
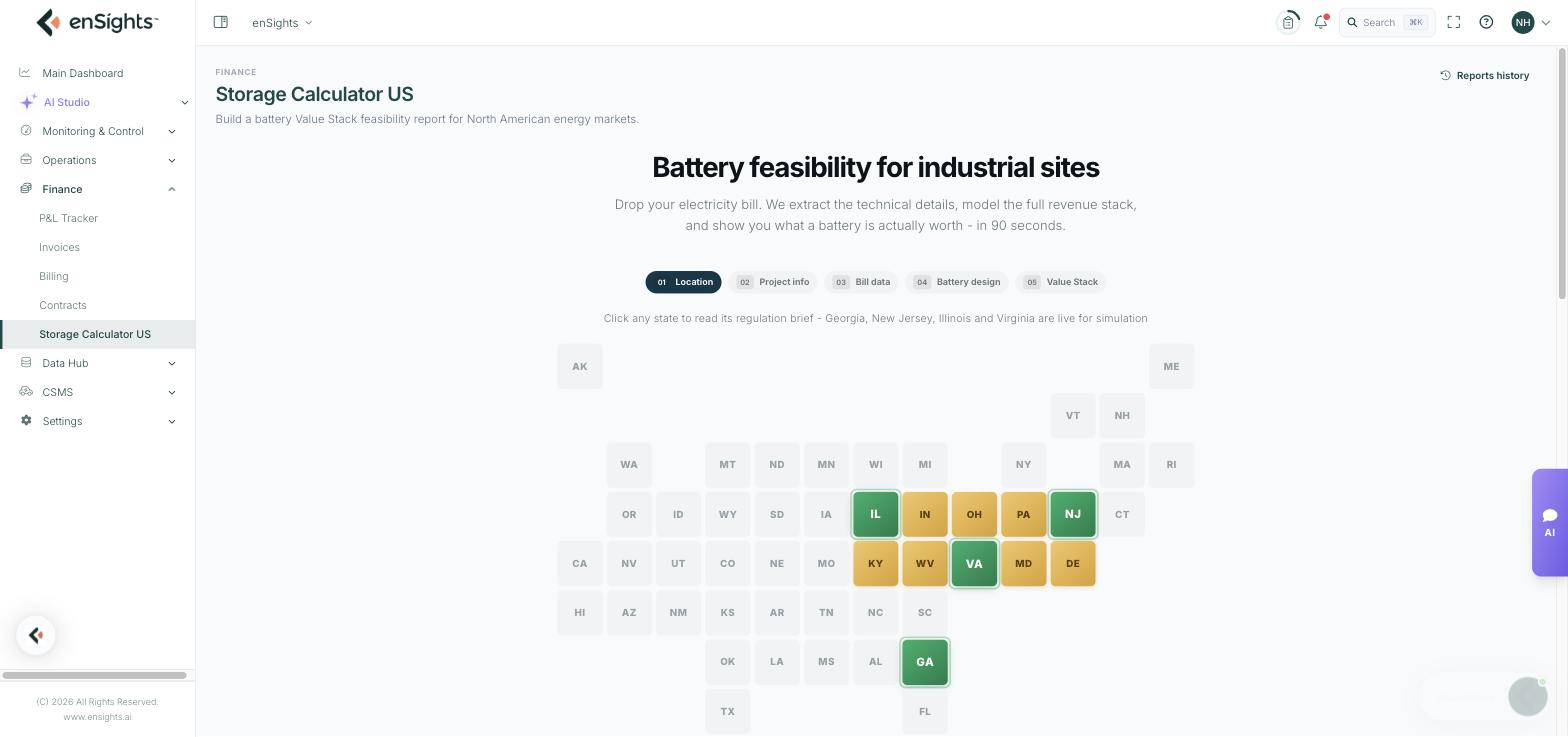
The state picker is a stylised grid of US states rather than a dropdown, and the colours matter:
- Green states are live for simulation. At the time of writing: Georgia, New Jersey, Illinois and Virginia.
- Amber states have a regulation brief you can read, but are not yet modelled.
- Grey states have neither yet.
Clicking any coloured state opens its regulation brief. Only a green state lets you continue into a simulation.
The regulation brief
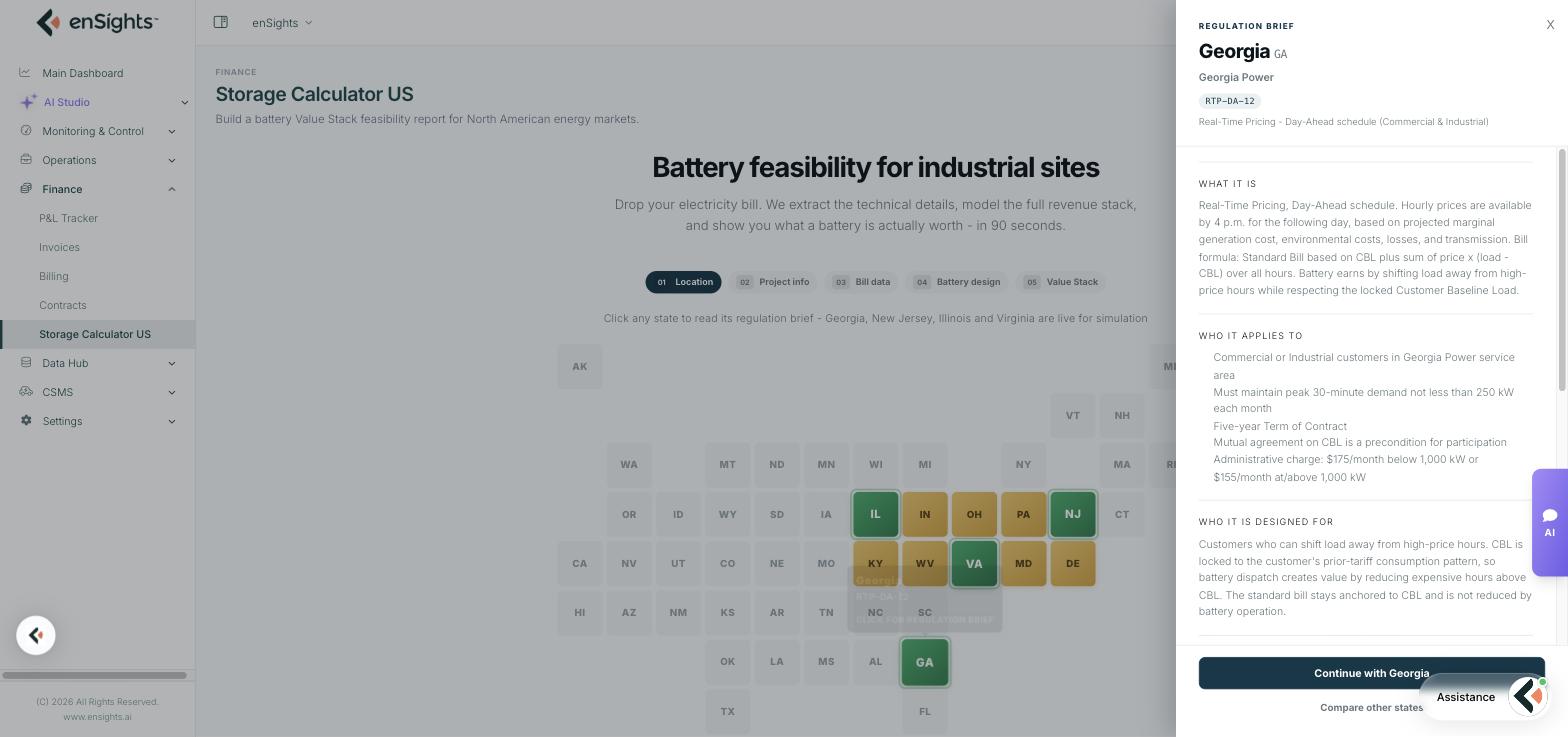
The brief slides in from the right and is worth reading before you model anything, because it tells you whether the site even qualifies. It names the utility and the tariff code, and is organised into:
- What it is — how the tariff works, including the bill formula the model applies.
- Who it applies to — the eligibility conditions: customer class, minimum demand, contract term, any administrative charges.
- Who it is designed for — the kind of site where the tariff actually produces value, and why.
At the bottom, Continue with [state] takes you into step 2 with that state selected, and Compare other states returns you to the map.
Read the eligibility conditions first. A site that can't meet the minimum demand or the contract term won't benefit from the tariff no matter what the model returns.
Step 2 — Project info
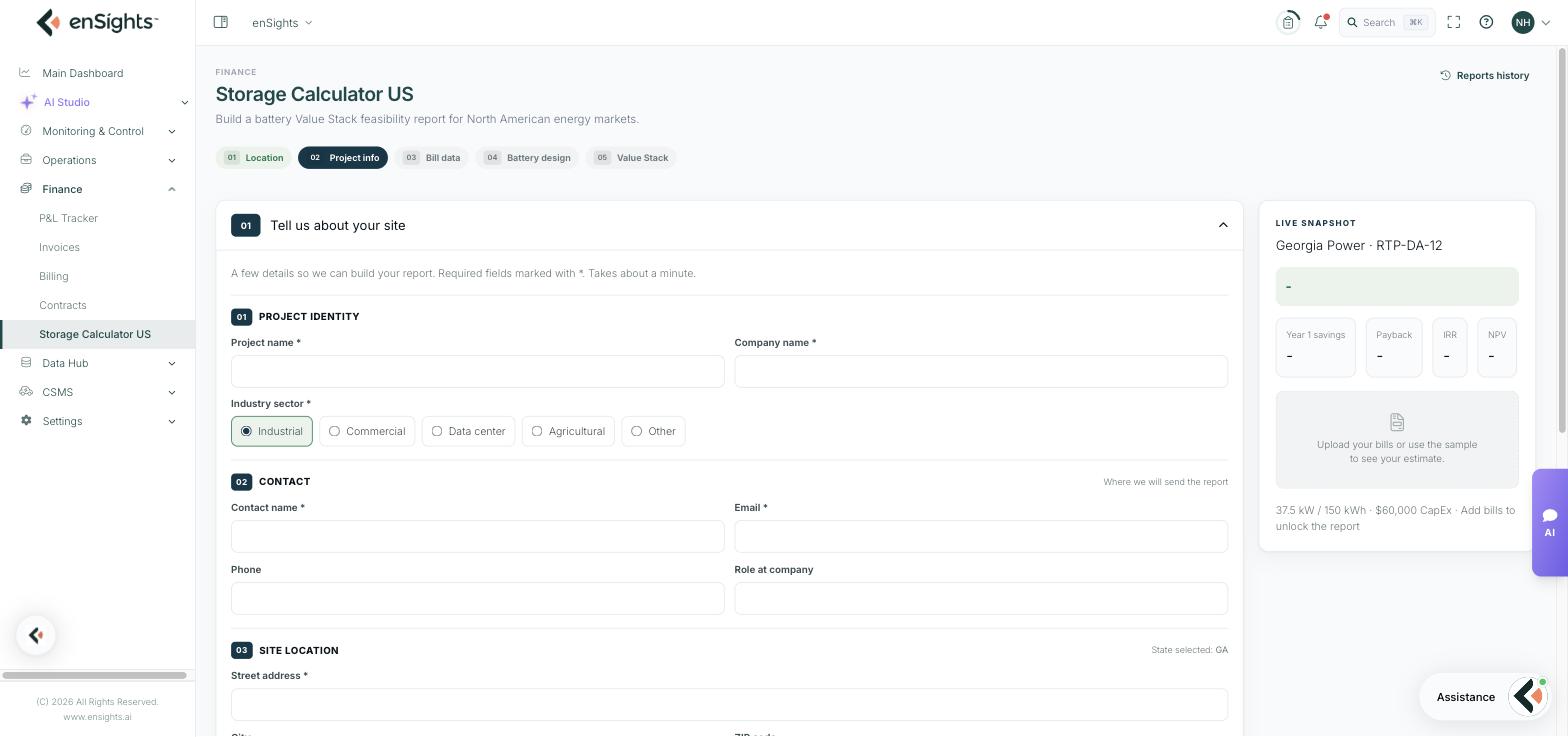
Three numbered blocks, with required fields marked by an asterisk. The page estimates it takes about a minute.
- 01 Project identity — Project name, Company name, and Industry sector (Industrial, Commercial, Data center, Agricultural, Other). The sector shapes the assumed load pattern, so it is worth getting right rather than defaulting.
- 02 Contact — Contact name and Email are required; Phone and Role at company are optional. The note beside the heading explains why: this is where the finished report is sent.
- 03 Site location — the street address, with the state you chose in step 1 shown beside the heading.
The Live Snapshot panel
The panel down the right shows the utility and tariff you selected, and four headline results — Year 1 savings, Payback, IRR and NPV. They stay as dashes until there is enough input to compute them, and update as you go.
Underneath it shows the current assumed configuration (for example 37.5 kW / 150 kWh with a stated CapEx) and tells you what is still missing — typically "Add bills to unlock the report". That line is the quickest way to know what the model still needs.
Steps 3 to 5 — bills, battery and the value stack
- Bill data — upload the site's electricity bills and the calculator extracts the technical details from them; a sample is available if you want to see the shape of the output before you have real bills. The bills are what turn the headline figures from dashes into numbers, because the value of a battery depends almost entirely on the shape of the site's demand and the tariff applied to it.
- Battery design — power and energy capacity, with technology benchmarks to compare against. Changing the design changes CapEx, and therefore payback and IRR.
- Value Stack — the finished report. It sets out the revenue streams the battery can earn under the selected tariff and the resulting financial result.
Reports history
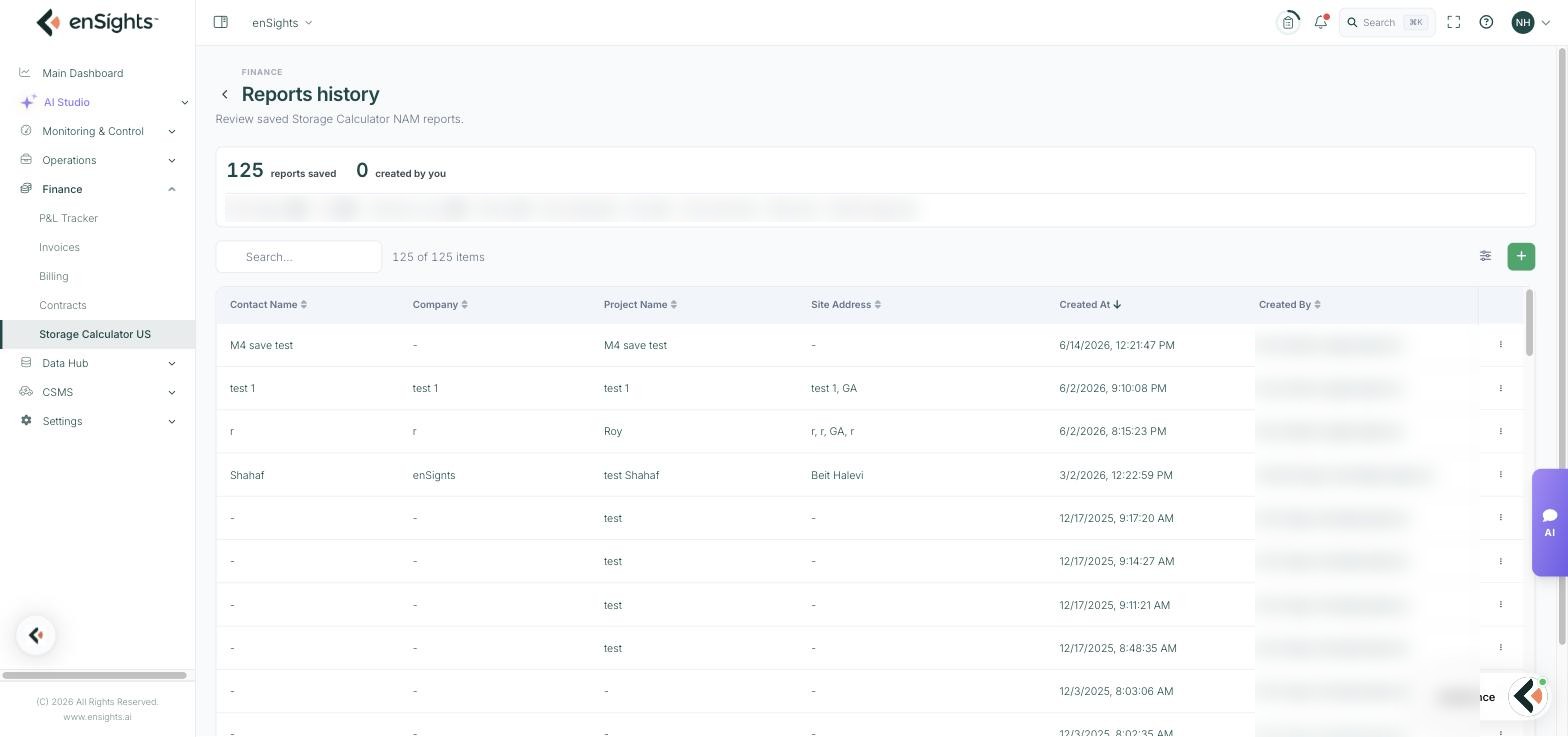
Reports history, at the top right of the page, lists every saved report. The header shows the total saved and how many of them are yours, and the table gives Contact Name, Company, Project Name, Site Address, Created At and Created By, all sortable, with a search box and a row menu on each report.
Because reports are shared across the account, the history is a useful record of what has already been quoted for a site — and worth checking before you model something a colleague has already modelled. The + button starts a new report.
How to
Screen a new site
- Open Storage Calculator US and click the site's state on the map.
- Read the regulation brief, especially Who it applies to. If the site can't meet the eligibility conditions, stop here.
- Click Continue with [state].
- Fill in project identity, pick the correct industry sector, and enter the contact the report should go to.
- Upload the electricity bills at step 3, or load the sample to see what the report looks like.
- Set the battery design at step 4 and watch Payback and IRR in the Live Snapshot as you change it.
- Review the Value Stack and save the report.
Compare two states for the same customer
- Read both regulation briefs from the map before modelling — the tariff mechanics often decide the answer on their own.
- Run a separate report for each state with the same bills and battery design.
- Compare them side by side from Reports history.
Notes
- Only green states simulate. Amber states have a brief you can read but no model behind them yet. The list grows over time, so check the map rather than relying on what you saw last quarter.
- The bills drive everything. Without them the calculator can only show a default configuration and dashes. Partial or unrepresentative bills produce a confident-looking but unreliable result.
- Industry sector is a modelling input, not a label. It affects the assumed load profile — leaving it on the default when the site is a data centre will skew the answer.
- Treat the output as a screening result. It is built on published tariff and incentive data and a modelled load; it is the right tool for deciding whether a project is worth pursuing, not a substitute for a bankable model.
- Reports are visible to the account, not just to you. The contact details you enter are stored with the report — worth knowing before entering a customer's personal phone number.